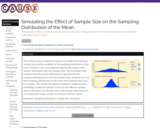
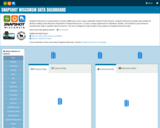
Snapshot Wisconsin is a partnership to monitor wildlife year-round, using a statewide …
Snapshot Wisconsin is a partnership to monitor wildlife year-round, using a statewide network of trail cameras. Snapshot Wisconsin provides data needed for decision making at the Wisconsin Department of Natural Resources. It is also a unique opportunity for individuals, families, and students to get involved in monitoring the state’s valuable natural resources. This tool is designed to help visualize many aspects of Snapshot Wisconsin data.
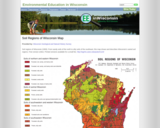
This map shows 15 general soil regions of Wisconsin. On the landscape, …
This map shows 15 general soil regions of Wisconsin. On the landscape, many of these regions appear distinctly different from each other because differences in land form and use are often related to the characteristics of the soils. Map is available from ~ University of Wisconsin-Extension, GNHC, and Wisconsin Geological and Natural History Survey. F.w. Madison, Wisconsin Geological and Natural History Survey H.F. Gundlach, U.S. Department of Agriculture, Soil Conservation Service. 1993.
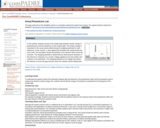
This is an activity about space weather. Learners will use the Internet, …
This is an activity about space weather. Learners will use the Internet, print, video, CDROM, or other sources of information to research the answers to questions specifically related to solar wind and its impact on Earth. This is Activity 10 of the Space Weather Forecast curriculum.
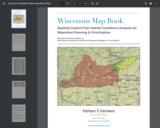
In 2012, the Fishers & Farmers Partnership for the Upper Mississippi River …
In 2012, the Fishers & Farmers Partnership for the Upper Mississippi River Basin (FFP) contracted to have a spatially explicit analysis of fish habitat condition performed using Geospatial Information Systems (GIS). Spatially explicit habitat assessment models, such as the models used in this map book, provide a robust interpretation of terrestrial and aquatic data and the relationships and influence of landscape activities (Martin et al., 2012). Aquatic and terrestrial data were collected throughout the Upper Mississippi River Basin (UMRB) and modeled using Boosted Regression Tree (BRT) modeling and validated using an internal cross-validation method (Elith et al., 2008). The FFP, and their fiscal agent the Dubuque County Historical Society, entered a cooperative agreement with the Natural Resources Conservation Service (NRCS) for composition of geospatial data and printable map books to guide conservation efforts throughout the basin. The UMRB is comprised of 139 Hydrologic Unit Code-8 (HUC-8) watersheds and over 180,000 catchments (1:100k National Hydrography Dataset) and 12 different Level III Eco-Regions (CEC, 1997). The diversity of the landscape across the basin, and the sheer size of the basin, poses management and prioritization issues when performing large scale assessments. The production of state-scale map books provides a local assessment of modeling outcomes for distribution and reference. The data represented in this map book were derived from models, analyses, and data developed by Downstream Strategies, LLC. and their partners (DS). Data were provided to PA contracted by the FFP to serve as the Science Team Lead and Geospatial Coordinator.
"I'd like to suggest the educational technology resource: SpinnerWheel.com Spinner Wheel is …
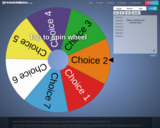
"I'd like to suggest the educational technology resource: SpinnerWheel.com
Spinner Wheel is a free online tool that allows for a flexible and engaging approach to learning. It has many use-cases for any subject.
All entries on wheels are fully editable and one of the main things that makes it so useful is the ability to create multiple wheels for use at one time.
An example use of Spinner Wheel for mathematics: https://spinnerwheel.com/mental-mathematics-quiz and for creative writing: https://spinnerwheel.com/short-burst-writing-ideas-generator
From creating multiple random number generators to equitably selecting students from a group, the possibilities for using this resource in a learning environment are practically endless."
Literacy, Reading, Math, SPED Specialists may upload this template to modify and …
Literacy, Reading, Math, SPED Specialists may upload this template to modify and use as a daily schedule and lesson plan guide when working with multiple groups across sites.
Literacy Specialists, Reading Specialists, SPED, Educators and administrators may use this template …
Literacy Specialists, Reading Specialists, SPED, Educators and administrators may use this template to collect data. This is a spread sheet that may be used K-8. This tool allows teams to collect and share data in a document that is easy to use, pull up and look at when working in collaboration with teams that include specialists, administrators, educators and parents working to close gaps for struggling learners. While created for reading interventions it may be used for all interventions in multiple academic settings.
This module guides students through some relatively new satellite meteorology satellites. It …
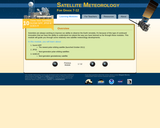
This module guides students through some relatively new satellite meteorology satellites. It is part of an online course for grades 7-12 in satellite meteorology, which includes 10 modules with numerous interactives. The site also includes lesson plans developed by teachers and links to related resources. Each module is designed to serve as a stand-alone lesson, however, a sequential approach is recommended. Designed to challenge students through the end of 12th grade, middle school teachers and students may choose to skim or skip a few sections.
This is an activity about cause and effect. Learners will calculate the …
This is an activity about cause and effect. Learners will calculate the approximate travel time of each solar wind event identified in the previous activity in this set to estimate the time at which the disturbance would have left the Sun. Then, they will examine solar images in an attempt to identify the event on the Sun that may have caused the specific solar wind episode. This is Activity 12 of the Space Weather Forecast curriculum.
This is a hands on activity where students will see how instruments …
This is a hands on activity where students will see how instruments can be used to warn people of a tsunami. This activity demonstration can be flexible to the needs and ages of the students and can be a game or a conversation.
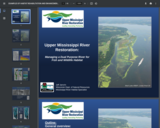
General overview: • Human alterations to the River ecosystem • Events that …
General overview: • Human alterations to the River ecosystem • Events that set groundwork for authorization of UMRR Examples of HREP Design and Features: • Island Restoration • Dredging • Mechanical • Hydraulic
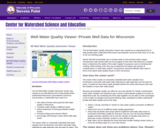
The WI Well Water Quality Interactive Viewer was created as an educational …
The WI Well Water Quality Interactive Viewer was created as an educational tool to help people better understand Wisconsin's groundwater resources. Communities or individuals have used it to:
See what is known about general well water quality in Wisconsin. Compare water quality in different areas. Raise awareness of local groundwater quality issues. Promote testing and outreach efforts. Encourage well testing in areas where little data exists. The viewer relies on voluntarily submitted well water samples from homeowners and other well water data collected by state agencies over the past 25 years. This includes private well water quality data from the Center for Watershed Science and Education, the WI Dept. of Ag, Trade and Consumer Protection, and the WI Department of Natural Resources Groundwater Retrieval Network, Eau Claire County Health Dept and La Crosse County Health Dept.
The WI Well Water Viewer does not represent well water quality information for all known private wells. This information is not intended to be a substitute for well water testing and the viewer does not provide site specific information for an individual well or property. The Center for Watershed Science and Education is not responsible for misuse or misinterpretation of the data.
The compilation of data was assisted by a grant through the Environmental Public Health Tracking Program through the WI Department of Health Services.
Using three-dimensional scaffolds, these materials address the following topics: - Cells and cell …
Using three-dimensional scaffolds, these materials address the following topics: - Cells and cell function- Animal growth and development- Digestion & cellular respiration - Biosynthesis Each packet is broken into five parts - data dive, core ideas, investigations, asssessments, and life connections. Formative assessments and checkpoints are embedded throughout each packet. The final packet prepares students for a summative assessment, with a provided practice assessment.Implementation instructions are embedded for each component of each packet. PDFs are included as attachments (in case the file formats are altered by this system).
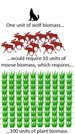
Using three-dimensional scaffolds, these materials address the following topics: - Interactions among living …
Using three-dimensional scaffolds, these materials address the following topics: - Interactions among living species.- 10% rule and carrying capacity.- Ecosystem disruptions, including climate change. - Sustainability. Each packet is broken into five parts - data dive, core ideas, investigations, asssessments, and life connections. Formative assessments and checkpoints are embedded throughout each packet. The final packet prepares students for a summative assessment, with a provided practice assessment.Implementation instructions are embedded for each component of each packet. PDFs are included as attachments (in case the file formats are altered by this system).
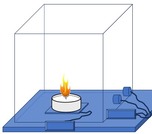
Using three-dimensional scaffolds, these materials address the following topics: - Atoms, elements, and …
Using three-dimensional scaffolds, these materials address the following topics: - Atoms, elements, and molecules.- Properties of matter and energy. - Reasoning across systems and scale- Conservation of matter- Combustion as a rearrangement reaction- Chemical bondsEach packet is broken into five parts - data dive, core ideas, investigations, asssessments, and life connections. Formative assessments and checkpoints are embedded throughout each packet. The final packet prepares students for a summative assessment, with a provided practice assessment.Implementation instructions are embedded for each component of each packet. PDFs are included as attachments (in case the file formats are altered by this system).
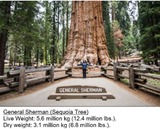
Using three-dimensional scaffolds, these materials address the following topics: - Plant Cells and …
Using three-dimensional scaffolds, these materials address the following topics: - Plant Cells and cell function in comparison to animal cells. - Photosynthesis- Biosynthesis - Planning and conducting investigations & experiments. Each packet is broken into five parts - data dive, core ideas, investigations, asssessments, and life connections. Formative assessments and checkpoints are embedded throughout each packet. The final packet prepares students for a summative assessment, with a provided practice assessment.Implementation instructions are embedded for each component of each packet. PDFs are included as attachments (in case the file formats are altered by this system).
Using three-dimensional scaffolds, these materials address the following topics: - Relationships between DNA, …
Using three-dimensional scaffolds, these materials address the following topics: - Relationships between DNA, proteins, and traits.- How mitosis enables each cell to receive a copy of DNA.- How gametes like sperm and eggs are formed and transmit parents' genes to offspring. - Predicting traits based on parents' genotypes and phenotypes using Punnett squares. Each packet is broken into five parts - data dive, core ideas, investigations, asssessments, and life connections. Formative assessments and checkpoints are embedded throughout each packet. The final packet prepares students for a summative assessment, with a provided practice assessment.Implementation instructions are embedded for each component of each packet. PDFs are included as attachments (in case the file formats are altered by this system).
No restrictions on your remixing, redistributing, or making derivative works. Give credit to the author, as required.
Your remixing, redistributing, or making derivatives works comes with some restrictions, including how it is shared.
Your redistributing comes with some restrictions. Do not remix or make derivative works.
Most restrictive license type. Prohibits most uses, sharing, and any changes.
Copyrighted materials, available under Fair Use and the TEACH Act for US-based educators, or other custom arrangements. Go to the resource provider to see their individual restrictions.