Updating search results...

Search Resources

54 Results

View
Selected filters:
  • Data Set
Are All Stars Like The Sun?
Read the Fine Print
Rating
0.0 stars

This is an activity about comparing images of the Sun in different wavelengths of light. Learners will examine solar images taken by the SOHO spacecraft to look for differences in the features that are visible in the various wavelengths of light. This activity requires access to the internet to view or print images of the Sun. This is Activity 7 of the Sun As a Star afterschool curriculum.

Subject:
Career and Technical Education
Mathematics
Technology and Engineering
Material Type:
Activity/Lab
Data Set
Diagram/Illustration
Full Course
Lesson Plan
Provider:
NASA
Provider Set:
NASA Wavelength
Date Added:
10/13/2017
Can Venus and Mars Be Made Habitable?
Read the Fine Print
Rating
0.0 stars

This activity is about planetary climate. Once familiar with the factors that determine a planet's surface temperature, learners will use an interactive spreadsheet model of a planet's atmosphere to determine if greenhouse gases, luminosity of the source, the distance of the planet from the source and the albedo of the planet can be manipulated so that the average surface temperature on Mars or Venus could support human life. Learners will then be asked to make some conclusions about these methods and suggest improvements for the spreadsheet model (see related resources for link to this model). The activity requires use of Microsoft Excel software. This is Activity D in the fourth module, titled "How do Atmospheres Affect Planetary Temperatures?," of "Earth Climate Course: What Determines a Planet's Climate?."

Subject:
Atmospheric Science
Earth and Space Science
Ecology
Forestry and Agriculture
Life Science
Mathematics
Physical Science
Physics
Material Type:
Data Set
Full Course
Student Guide
Provider:
NASA
Provider Set:
NASA Wavelength
Date Added:
10/13/2017
Can you Planet?
Read the Fine Print
Rating
0.0 stars

This is an activity about classifying planetary characteristics. Learners will analyze the provided information about each planet in order to make graphs and Venn diagrams. Then, using both, learners will identify similarities and differences of the planets in the Solar System. This is Activity C-11 as part of The Universe At Your Fingertips curriculum, available for purchase.

Subject:
Career and Technical Education
Mathematics
Physical Science
Physics
Technology and Engineering
Material Type:
Activity/Lab
Assessment
Data Set
Diagram/Illustration
Full Course
Interactive
Lecture Notes
Lesson Plan
Provider:
NASA
Provider Set:
NASA Wavelength
Date Added:
10/13/2017
Charting a Forecast and Following Up
Read the Fine Print
Rating
0.0 stars

This is an activity about solar flare activity. Learners will use whole-Sun maps of magnetic activity in order to identify possible future magnetic activity. They will take into account the rotation of the Sun and make day-to-day predictions of the overall Earth-side magnetic activity as suspected farside features rotate onto the Earth-side, and as Earth-side features rotate out of view onto the farside. Finally, learners will check the accuracy of their predictions. This activity requires access to the internet to obtain images from the Stanford University solar magnetic map archive from 1996 to 2011 and the GOES X-ray image archive. This is Activity 9 of the Space Weather Forecast curriculum.

Subject:
Mathematics
Physical Science
Physics
Material Type:
Activity/Lab
Data Set
Diagram/Illustration
Full Course
Lesson Plan
Provider:
NASA
Provider Set:
NASA Wavelength
Date Added:
10/13/2017
Christmas Bird Count
Conditional Remix & Share Permitted
CC BY-NC
Rating
0.0 stars

A pdf file that contains slides with visuals to be shown. It explains the CBC from its beginning to end with an example of Data taken from our local bird count.

Students will be instructed to build a data table and graph representing data. Then draw conclusions.

Subject:
Ecology
Environmental Science
Life Science
Mathematics
Measurement and Data
Material Type:
Data Set
Lecture Notes
Date Added:
08/02/2019
Clouds
Read the Fine Print
Rating
0.0 stars

In this scenario-based, problem-based learning (PBL) activity, students investigate cloud formation, cloud classification, and the role of clouds in heating and cooling the Earth; how to interpret TRMM (Tropical Rainfall Measuring Mission) images and data; and the role clouds play in the Earth’s radiant budget and climate. Students assume the role of weather interns in a state climatology office and assist a frustrated student in a homework assignment. Learning is supported by a cloud in a bottle and an ice-albedo demonstration, a three-day cloud monitoring outdoor activity, and student journal assignments. The hands-on activities require two 2-liter soda bottles, an infrared heat lamp, and two thermometers. The resource includes a teacher's guide, questions and answer key, assessment rubric, glossary, and an appendix with information supporting PBL in the classroom.

Subject:
Atmospheric Science
Earth and Space Science
Oceanography
Material Type:
Activity/Lab
Assessment
Data Set
Lesson Plan
Provider:
NASA
Provider Set:
NASA Wavelength
Date Added:
11/09/2017
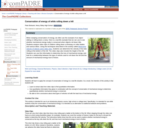
Conservation of Energy of While Rolling Down a Hill
Read the Fine Print
Educational Use
Rating
0.0 stars

Students analyze video clips of kids rolling down a hill on skates, scooters, and bikes to determine whether mechanical energy is conserved.

Subject:
Physical Science
Physics
Material Type:
Activity/Lab
Data Set
Lecture
Provider:
Science Education Resource Center (SERC) at Carleton College
Provider Set:
Pedagogy in Action
Author:
Peter Bohacek
Date Added:
02/10/2023
Does The Sun Move?
Read the Fine Print
Rating
0.0 stars

This is an activity about modeling the apparent motion of the Sun as seen from Earth. Learners will use a flashlight, toothpick, and styrofoam model Sun to mimic the relative shadow motion produced by a sundial. The activity will help learners understand that because the Earth rotates from West to East, the Sun appears to rise in the East and set in the West. This is Activity 6 of the Sun As a Star afterschool curriculum.

Subject:
Mathematics
Material Type:
Activity/Lab
Data Set
Full Course
Lesson Plan
Provider:
NASA
Provider Set:
NASA Wavelength
Date Added:
10/13/2017
Drawing a Sunspot Map
Read the Fine Print
Rating
0.0 stars

This is an activity about observing and mapping sunspots by direct solar observation. Learners will use a small telescope, binoculars, or a Sunspotter to create a projected image of the Sun and trace the position of any observed sunspots on a piece of paper. Additionally, learners will mark the direction of the Sun image’s motion. This is Activity 2 of the Space Weather Forecast curriculum.

Subject:
Physical Science
Physics
Material Type:
Activity/Lab
Data Set
Full Course
Provider:
NASA
Provider Set:
NASA Wavelength
Date Added:
10/13/2017
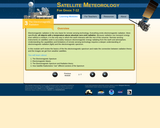
The Electromagnetic Spectrum
Read the Fine Print
Rating
0.0 stars

This interactive, online module reviews the basics of the the electromagnetic spectrum and makes the connection between radiation theory and the images we get from weather satellites. Students will learn about: the electromagnetic spectrum; electromagnetic waves; the electromagnetic spectrum and radiation theory; and how satellite radiometers "see" different sections of the spectrum. The module is part of an online course for grades 7-12 in satellite meteorology, which includes 10 interactive modules. The site also includes lesson plans developed by teachers and links to related resources. Each module is designed to serve as a stand-alone lesson, however, a sequential approach is recommended. Designed to challenge students through the end of 12th grade, middle school teachers and students may choose to skim or skip a few sections.

Subject:
Career and Technical Education
Physical Science
Physics
Technology and Engineering
Material Type:
Activity/Lab
Data Set
Full Course
Lecture Notes
Unit of Study
Provider:
NASA
Provider Set:
NASA Wavelength
Date Added:
10/13/2017
Energy Usage Spreadsheet CATE Lesson Plan
Conditional Remix & Share Permitted
CC BY-NC-SA
Rating
0.0 stars

Students will be using real-life energy use data to learn how to use spreadsheets and create graphs to better organize and view data. Discussions can then follow to analyze the data and explain the usage. Real rates are then provided, and students can use the electricity consumed data to create a utility bill for the consumer and compare the standard Residential Service charges to if the member were instead billed by the “Time of Use” rate.

Subject:
Mathematics
Measurement and Data
Numbers and Operations
Material Type:
Activity/Lab
Data Set
Lesson Plan
Primary Source
Author:
Sierra Erdmann
Date Added:
12/22/2017
English Language Learners Create a Botanic Field Guide
Conditional Remix & Share Permitted
CC BY-NC-SA
Rating
0.0 stars

ELL students create and share a botanic field guide incorporating depiction, measurement, description, and classification of common Minnesota trees, shrubs, wildflowers, and plants.

Subject:
Botany
Education
Language Education (ESL)
Life Science
Material Type:
Activity/Lab
Data Set
Provider:
Science Education Resource Center (SERC) at Carleton College
Provider Set:
Pedagogy in Action
Author:
Nenette Onstad
Date Added:
02/10/2023
Family Science Night Facilitators Guide
Read the Fine Print
Rating
0.0 stars

The 9-session NASA Family Science Night program invites middle school children and their families to discover the wide variety of science, technology, engineering, and mathematics being performed at NASA and in everyday life. Family Science Night programs explore various themes on the Sun, the Moon, the Stars, and the Universe through fun, hands-on activities, including at-home experiments. Information about Family Science Night implementation and support resources, including the facilitator's guide, are available by registering on the Family Science Night Facilitators website (see Related & Supplemental Resources for link).

Subject:
Career and Technical Education
Mathematics
Physical Science
Physics
Technology and Engineering
Material Type:
Activity/Lab
Data Set
Diagram/Illustration
Full Course
Lesson Plan
Simulation
Provider:
NASA
Provider Set:
NASA Wavelength
Date Added:
10/13/2017
Far Sight
Read the Fine Print
Rating
0.0 stars

This is an activity about using what you can see to identify what you cannot see. Learners will examine images of the Sun taken over one complete solar rotation and look for data features that appear on the farside of the Sun which persist at the same location as the Sun rotates to bring that part to the side facing Earth. This activity requires access to the internet to obtain images from the Stanford University solar magnetic map archive from 1996 to 2011. This is Activity 6 of the Space Weather Forecast curriculum.

Subject:
Physical Science
Physics
Material Type:
Activity/Lab
Data Set
Diagram/Illustration
Full Course
Lesson Plan
Provider:
NASA
Provider Set:
NASA Wavelength
Date Added:
10/13/2017
Fast Plants Simulations
Read the Fine Print
Rating
0.0 stars

Description and links to computer simulations that allow students to perform genetic crosses quickly. Students can use these simulations to test their genetic models developed from experiments done in the classroom with actual Fast Plants. These simulations were developed in 2000-2001 by Tom Whitaker and were tested successfully by hundreds of students at Madison West High School in Madison, Wisconsin as part of a new approach to genetics used by the Biology I team.

Subject:
Botany
Life Science
Material Type:
Data Set
Simulation
Provider:
Wisconsin Fast Plants Program
Provider Set:
Wisconsin Fast Plants Activity and Resource Library
Author:
Lauffer, Hedi Baxter
The Wisconsin Fast Plants Program
Date Added:
10/31/2001
Finding Other Effects on the Earth
Read the Fine Print
Rating
0.0 stars

This is an activity about cause and effect. Learners will investigate various online sources to find data and other pertinent information regarding reported effects on Earth for the solar events they identified in the previous activities in this curriculum set. Then, they will summarize their findings for this activity as part of the overall Space Weather project. This is Activity 13 of the Space Weather Forecast curriculum.

Subject:
Mathematics
Physical Science
Physics
Material Type:
Activity/Lab
Data Set
Full Course
Lesson Plan
Provider:
NASA
Provider Set:
NASA Wavelength
Date Added:
10/13/2017
Finding Space Weather Events
Read the Fine Print
Rating
0.0 stars

This is an activity about searching online data archives for solar wind events. Learners will find at least three episodes of increased solar wind activity impacting Earth using direct measurements of solar wind velocity and density. Then, they will characterize each events by its rise time, the time it takes for the solar wind speed to rise from normal levels to the peak speed of the event, and the percentage increase in solar wind velocity. This is Activity 11 of the Space Weather Forecast curriculum.

Subject:
Mathematics
Physical Science
Physics
Material Type:
Activity/Lab
Data Set
Full Course
Lesson Plan
Provider:
NASA
Provider Set:
NASA Wavelength
Date Added:
10/13/2017
How Do Scientists Look At The Sun?
Read the Fine Print
Rating
0.0 stars

This is an activity about comparing images of the Sun in different wavelengths of light. Learners will examine solar images taken by the SOHO spacecraft to look for differences in the features that are visible in the various wavelengths of light. This activity requires access to the internet to view or print images of the Sun. This is Activity 7 of the Sun As a Star afterschool curriculum.

Subject:
Career and Technical Education
Mathematics
Physical Science
Physics
Technology and Engineering
Material Type:
Activity/Lab
Data Set
Diagram/Illustration
Full Course
Lesson Plan
Provider:
NASA
Provider Set:
NASA Wavelength
Date Added:
10/13/2017