Data inquiry is most effective with sound foundational cultures and systems to access and use data. Through self-assessment, leadership teams become aware of their organizational data structures and processes as well as their role in leading staff through data use. The purpose of this self-assessment is for teams to gauge the level of data-informed leadership within their school or district culture. Designed for school, district or teacher leadership teams, this collaborative self-assessment helps team members examine and be informed about data leadership facets currently in their school or district. Results from this team process are used to guide actions to improve data cultures, systems, and use.
97 Results
Snapshot Wisconsin is a partnership to monitor wildlife year-round, using a statewide network of trail cameras. Snapshot Wisconsin provides data needed for decision making at the Wisconsin Department of Natural Resources. It is also a unique opportunity for individuals, families, and students to get involved in monitoring the state’s valuable natural resources. This tool is designed to help visualize many aspects of Snapshot Wisconsin data.
- Subject:
- Agriculture, Food and Natural Resources
- Art and Design
- Biology
- Career and Technical Education
- Ecology
- Environmental Science
- Fine Arts
- Forestry and Agriculture
- Genetics
- Life Science
- Marketing, Management and Entrepreneurship
- Zoology
- Material Type:
- Data Set
- Interactive
- Other
- Reference Material
- Author:
- SnapShot Wisconsin
- Wildlife Restoration
- Wisconsin Department of Natural Resources
- Date Added:
- 04/21/2024
This map shows 15 general soil regions of Wisconsin. On the landscape, many of these regions appear distinctly different from each other because differences in land form and use are often related to the characteristics of the soils. Map is available from ~ University of Wisconsin-Extension, GNHC, and Wisconsin Geological and Natural History Survey. F.w. Madison, Wisconsin Geological and Natural History Survey H.F. Gundlach, U.S. Department of Agriculture, Soil Conservation Service. 1993.
- Subject:
- Biology
- Botany
- Earth and Space Science
- Ecology
- Education
- Environmental Science
- Forestry and Agriculture
- Geology
- Higher Education
- Life Science
- Material Type:
- Data Set
- Diagram/Illustration
- Reference Material
- Author:
- F.W.; Gundlach
- H.F.;
- Madison
- Date Added:
- 03/03/2024
The goals of this textbook are to help students acquire the technical skills of using software and managing a database, and develop research skills of collecting data, analyzing information and presenting results. We emphasize that the need to investigate the potential and practicality of GIS technologies in a typical planning setting and evaluate its possible applications. GIS may not be necessary (or useful) for every planning application, and we anticipate these readings to provide the necessary foundation for discerning its appropriate use. Therefore, this textbook attempts to facilitate spatial thinking focusing more on open-ended planning questions, which require judgment and exploration, while developing the analytical capacity for understanding a variety of local and regional planning challenges.
While this textbook provides the background for understanding the concepts in GIS as applicable to urban and regional planning, it is best when accompanied by a hands-on tutorial, which will enable readers to develop an in-depth understanding of the specific planning applications of GIS. Chapters in this text book are either composed by the editors using Creative Common materials, or linked to a book chapter scanned copy in the library reserve. In the end of each chapter, we also provided several discussion questions, together with contextual applications through some web links.
- Subject:
- Geography
- Social Studies
- Material Type:
- Textbook
- Provider:
- Portland State University
- Provider Set:
- PDXOpen
- Author:
- Yiping Fang; Vivek Shandas; Eugenio Arriaga Cordero
- Date Added:
- 12/23/2014
The purpose of this course is to provide background in the ways in which psychologists evaluate data collected from research projects. A researcher may gather many pieces of data that describe a group of research subjects and there are common ways in which these pieces of information are presented. Secondly, statistical tests can help investigators draw inferences about the relationship of the research sample to the general population it is supposed to represent. As a student of psychology or any other discipline that uses research data to explore ideas, it is important that you know how data is evaluated and that you gain an understanding of the ways in which these procedures help to summarize and clarify data.
- Subject:
- Mathematics
- Psychology
- Social Studies
- Statistics and Probability
- Material Type:
- Full Course
- Provider:
- UMass Boston
- Provider Set:
- UMass Boston OpenCourseWare
- Author:
- Laurel Wainwright
- Date Added:
- 10/13/2017
Purpose:
The purpose of this resource is to understand the importance and legal requirements of protecting student data privacy and assess the status of current practices.
Description:
This resource is designed to be utilized collaboratively by district leadership teams and reinforced by school leadership teams. First, you will find guidance regarding policies, principles and protocols critical to protect student data. The checklist that follows is organized into eight items to assess and provide evidence regarding current status. Using the checklist, teams identify areas of need and plan actions to be taken to insure student privacy.
In this lesson, students learn how adaptations, limiting factors, and predator prey relationships all affect the survival of plants and animals. Predator-prey relationships are simulated in two games, where students record their experiences and display data in story and chart/graph form, and explore the adaptations of animals in terrestrial and aquatic habitats. Extension activities include habitat investigations in natural areas.
- Subject:
- Agriculture, Food and Natural Resources
- Career and Technical Education
- Material Type:
- Activity/Lab
- Formative Assessment
- Learning Task
- Author:
- Alison DeBaufer
- Amy Workman
- Rachel Burkel
- Date Added:
- 05/10/2019
Literacy Specialists, Reading Specialists, SPED, Educators and administrators may use this template to collect data. This is a spread sheet that may be used K-8. This tool allows teams to collect and share data in a document that is easy to use, pull up and look at when working in collaboration with teams that include specialists, administrators, educators and parents working to close gaps for struggling learners. While created for reading interventions it may be used for all interventions in multiple academic settings.
Literacy, Reading, SPED and administrators may use this form to document collaboration, planning and implementation of Tier 3 Intervention Plan.
- Subject:
- Early Learning
- Education
- Educational Technology
- Elementary Education
- Material Type:
- Curriculum Map
- Diagram/Illustration
- Lesson Plan
- Other
- Reference Material
- Teaching/Learning Strategy
- Date Added:
- 03/12/2019
How do you know if your ACP components are working for your students? Which students are being left behind in the ACP process? How can we improve our ACP program? It all comes down to DATA. Use this Community of Practice webinar to find out how you can use ACP data to identify gaps and improve your ACP program.
- Subject:
- Career and Technical Education
- Material Type:
- Other
- Author:
- Lynn Aprill
- Date Added:
- 12/13/2022
Students will have fun collecting data using the Coffee Shop Game. (1st resource) Then they will take the collected data and enter it on a spreadsheet and review how to graph on google spreadsheets! (2nd resource) Encourage students to problem solve how to make the best coffee and make the most money. Collaboration is encouraged!
- Subject:
- Business and Information Technology
- Career and Technical Education
- Material Type:
- Game
- Interactive
- Learning Task
- Simulation
- Provider:
- Coolmath.com LLC
- Date Added:
- 04/21/2016
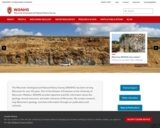
The Wisconsin Geological and Natural History Survey (WGNHS) has been serving Wisconsin for over 125 years. Part of the Division of Extension at the University of Wisconsin–Madison, WGNHS provides objective scientific information about the geology, mineral resources, and water resources of Wisconsin. We conduct research, map Wisconsin’s geology, and share information through our publications and outreach.
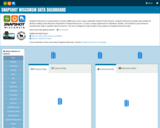
WGNHS has been producing geologic maps, scientific reports, and more for over 125 years. Our publications catalog offers thousands of maps, reports, datasets, and other publications—all of which are available to view and download for free.
The Wisconsin Geological and Natural History Survey (WGNHS) was created by the Wisconsin Legislature in 1897. It is the descendant of earlier state surveys in Wisconsin, which date back to 1854.
WGNHS, part of the Division of Extension at the University of Wisconsin–Madison, is an interdisciplinary organization that conducts natural resources surveys and research to produce information used for decision-making, problem-solving, planning, management, development, and education. Survey is defined to include resource inventory as well as basic and applied research and analysis. WGNHS has no specific regulatory or enforcement responsibilities.
Mission of WGNHS:
Understanding the earth • Charting its history • Sustaining its resources
The Survey conducts earth-science surveys, field studies, and research.
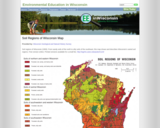
We provide objective scientific information about the geology, water resources, and mineral resources of Wisconsin.
We collect, interpret, disseminate, and archive natural resource information.
We communicate the results of our activities through publications, technical talks, our website, social media, and responses to inquiries from the public.
These activities support informed decision making by government, industry, business, and individual residents of Wisconsin.
- Subject:
- Agriculture, Food and Natural Resources
- Archaeology
- Biology
- Botany
- Career and Technical Education
- Civics and Government
- Earth and Space Science
- Ecology
- Education
- Environmental Science
- Forestry and Agriculture
- Geography
- Geology
- Higher Education
- Hydrology
- Life Science
- Social Studies
- Material Type:
- Activity/Lab
- Diagram/Illustration
- Homework/Assignment
- Other
- Date Added:
- 03/04/2024
The WI Well Water Quality Interactive Viewer was created as an educational tool to help people better understand Wisconsin's groundwater resources. Communities or individuals have used it to:
See what is known about general well water quality in Wisconsin.
Compare water quality in different areas.
Raise awareness of local groundwater quality issues.
Promote testing and outreach efforts.
Encourage well testing in areas where little data exists.
The viewer relies on voluntarily submitted well water samples from homeowners and other well water data collected by state agencies over the past 25 years. This includes private well water quality data from the Center for Watershed Science and Education, the WI Dept. of Ag, Trade and Consumer Protection, and the WI Department of Natural Resources Groundwater Retrieval Network, Eau Claire County Health Dept and La Crosse County Health Dept.
The WI Well Water Viewer does not represent well water quality information for all known private wells. This information is not intended to be a substitute for well water testing and the viewer does not provide site specific information for an individual well or property. The Center for Watershed Science and Education is not responsible for misuse or misinterpretation of the data.
The compilation of data was assisted by a grant through the Environmental Public Health Tracking Program through the WI Department of Health Services.
- Subject:
- Career and Technical Education
- Earth and Space Science
- Environmental Science
- Family and Consumer Sciences
- Geology
- Health Science
- Hydrology
- Life Science
- Nutrition Education
- Material Type:
- Data Set
- Interactive
- Author:
- David Mechenich
- Center for Watershed Science and Education
- Date Added:
- 02/20/2024
Prepared with pre-algebra or algebra 1 classes in mind, this module leads students through the process of graphing data and finding a line of best fit while exploring the characteristics of linear equations in algebraic and graphic formats. Then, these topics are connected to real-world experiences in which people use linear functions. During the module, students use these scientific concepts to solve the following hypothetical challenge: You are a new researcher in a lab, and your boss has just given you your first task to analyze a set of data. It being your first assignment, you ask an undergraduate student working in your lab to help you figure it out. She responds that you must determine what the data represents and then find an equation that models the data. You believe that you will be able to determine what the data represents on your own, but you ask for further help modeling the data. In response, she says she is not completely sure how to do it, but gives a list of equations that may fit the data. This module is built around the legacy cycle, a format that incorporates educational research feindings on how people best learn.
- Subject:
- Algebra
- Career and Technical Education
- Life Science
- Mathematics
- Technology and Engineering
- Material Type:
- Unit of Study
- Provider:
- TeachEngineering
- Provider Set:
- TeachEngineering
- Author:
- Aubrey Mckelvey
- TeachEngineering.org
- VU Bioengineering RET Program,
- Date Added:
- 09/18/2014
Water clarity monitoring is a process in which the volunteer lowers an 8” diameter, black & white disc (“Secchi disc”) into the deepest part of the lake to determine how far down they can see the disc as it is lowered. Water clarity monitoring is done every 10-14 days throughout the open-water season. Water clarity is a quick way to estimate lake health, and it plays an important role in determining the types of plants and animals that a water body can support.
Can also add in collected data for Water Chemistry analysis along with Secchi disc collected data.
This site includes data collection forms for individuals or groups to add their data from their own lake to this dataset.
- Subject:
- Agriculture, Food and Natural Resources
- Biology
- Career and Technical Education
- Ecology
- Environmental Science
- Life Science
- Material Type:
- Activity/Lab
- Homework/Assignment
- Lesson
- Author:
- Paul Skawinski
- college of Natural Resources
- University of Wisconsin Stevens Point
- Date Added:
- 04/24/2024
The National Water Information System (NWIS) Mapper provides access to over 1.5 million sites contained in the USGS National Water Information System (NWIS), including sites where current and historical surface-water, groundwater, springs, and atmospheric data has been collected. Users can search by site type, data type, site number, or place.
- Subject:
- Agriculture, Food and Natural Resources
- Atmospheric Science
- Business and Information Technology
- Career and Technical Education
- Earth and Space Science
- Ecology
- Education
- Elementary Education
- English Language Arts
- Environmental Literacy and Sustainability
- Environmental Science
- Forestry and Agriculture
- Geography
- Geology
- Health Education
- Health Science
- Higher Education
- Hydrology
- Life Science
- Literature
- Marketing, Management and Entrepreneurship
- Oceanography
- Social Studies
- Technology and Engineering
- Material Type:
- Activity/Lab
- Homework/Assignment
- Author:
- USGS (US Geological Survey)
- Date Added:
- 03/12/2024
The winter severity index (WSI) is a measurement to help gauge the effects of the winter weather on
deer survival. The index was developed in the early 1970’s and is calculated by adding the number of
days with 18 inches or more of snow on the ground to the number of days when the minimum
temperatures were 0◦
F or below. In general, the severity of the winter is based on the total number of
points accumulated over the collection period. A winter with an index of less than 50 is considered mild,
50 to 79 is moderate, 80 to 99 is severe, and over 100 is very severe.
- Subject:
- Ecology
- Life Science
- Mathematics
- Measurement and Data
- Material Type:
- Data Set
- Learning Task
- Date Added:
- 01/23/2019
This is the Wisconsin Department of Natural Resources GIS Open Data Portal. It is a free resource for locating, viewing, and downloading data developed and/or maintained by the Wisconsin DNR.
This site also has categories of: Water, Fish and Wildlife, Managed Lands, Cimate, Parks and Recreation, Forestry, Transportation, Indexess and PLSS, Boundaries and Land Cover and Vegetation.
The site also has Applications that include: PFAS in Wisconsin Data Viewer, Western Coulee and Ridges Regional Master Plan, North Central Forest Regional Master Plan, Wildfires Dashboard App, Report Invasive Species, CWD reporting, etc
- Subject:
- Agriculture, Food and Natural Resources
- Biology
- Botany
- Career and Technical Education
- Civics and Government
- Earth and Space Science
- Ecology
- Education
- Elementary Education
- Environmental Literacy and Sustainability
- Environmental Science
- Forestry and Agriculture
- Geography
- Geology
- Health Education
- Health Science
- Higher Education
- Hydrology
- Life Science
- Social Studies
- Zoology
- Material Type:
- Activity/Lab
- Homework/Assignment
- Learning Task
- Lecture
- Lesson
- Lesson Plan
- Author:
- Wisconsin Department of Natural Resources
- Date Added:
- 03/12/2024
Wisconsin’s climate is typically continental with some modification by Lakes Michigan and Superior. The cold, snowy winters favor a variety of winter sports, and the warm summers appeal to thousands of vacationers each year. About two-thirds of the annual precipitation falls during the growing season (freeze-free period). It is normally adequate for vegetation, although drought is occasionally reported. This climate is most favorable for dairy farming; the primary crops are corn, small grains, hay, and vegetables. The rapid succession of storms moving from west to east or southwest to northeast account for the stimulating climate.
Select from Climate by Location, Division, Normals, Statewide Extremes, Longterm Annual Variability, and Daily Climate data.
- Subject:
- Agriculture, Food and Natural Resources
- Atmospheric Science
- Biology
- Botany
- Career and Technical Education
- Earth and Space Science
- Ecology
- Education
- Elementary Education
- Environmental Science
- Family and Consumer Sciences
- Forestry and Agriculture
- Health Science
- Higher Education
- Hydrology
- Life Science
- Marketing, Management and Entrepreneurship
- Material Type:
- Activity/Lab
- Diagram/Illustration
- Homework/Assignment
- Interactive
- Author:
- Wisconsin State Climatology Office and Nelson Institute for Environmental Studies
- Date Added:
- 04/28/2024
Wisconsin's 15,000 lakes. The DNR partners with the University of Wisconsin - Extension and citizens around the state to help protect and maintain these amazing natural resources while providing some of the best recreational opportunities in the nation. More than 600 lake organizations and thousands of volunteers play a leadership role in the stewardship of Wisconsin's lakes.
Find a Lake, Lake Water Quality Data, Lake Maps, Plants and Aquatic invasive Insects - are all linked to this site.
- Subject:
- Agriculture, Food and Natural Resources
- Art and Design
- Biology
- Botany
- Career and Technical Education
- Ecology
- Environmental Literacy and Sustainability
- Environmental Science
- Fine Arts
- Forestry and Agriculture
- Life Science
- Zoology
- Material Type:
- Activity/Lab
- Data Set
- Diagram/Illustration
- Interactive
- Author:
- Wisconsin Department of Natural Resources
- Date Added:
- 04/23/2024