Updating search results...

Search Resources

598 Results

View
Selected filters:
  • chemistry
Why Don't I Feel Better Yet? Examining the effect of dose, time interval, and elimination rate on attaining a therapeutic drug level
Conditional Remix & Share Permitted
CC BY-NC-SA
Rating
0.0 stars

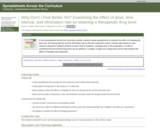
Spreadsheets across the Curriculum module. Students use a spreadsheet to build a two-way table of drug level vs. time and elimination rate with parameters dosage interval and amount.

Subject:
Chemistry
Life Science
Mathematics
Physical Science
Material Type:
Activity/Lab
Provider:
Science Education Resource Center (SERC) at Carleton College
Provider Set:
Pedagogy in Action
Author:
Cheryl Coolidge
Date Added:
02/10/2023
Will the Cup of Water Overflow When the Ice Melts?
Conditional Remix & Share Permitted
CC BY-NC-SA
Rating
0.0 stars

This activity is an in-class experiment where students predict, observe, and summarize what will happen when ice melts in a cup of water.

Subject:
Chemistry
Physical Science
Material Type:
Activity/Lab
Lesson Plan
Provider:
Science Education Resource Center (SERC) at Carleton College
Provider Set:
Pedagogy in Action
Author:
Mary Haliburton
Date Added:
02/10/2023
Wisconsin Lakes Data - Lake Water Quality Data - Lake Maps - Plants and Aquatic Insects
Unrestricted Use
Public Domain
Rating
0.0 stars

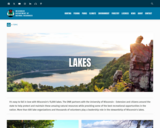
Wisconsin's 15,000 lakes. The DNR partners with the University of Wisconsin - Extension and citizens around the state to help protect and maintain these amazing natural resources while providing some of the best recreational opportunities in the nation. More than 600 lake organizations and thousands of volunteers play a leadership role in the stewardship of Wisconsin's lakes.

Find a Lake, Lake Water Quality Data, Lake Maps, Plants and Aquatic invasive Insects - are all linked to this site.

Subject:
Agriculture, Food and Natural Resources
Art and Design
Biology
Botany
Career and Technical Education
Ecology
Environmental Literacy and Sustainability
Environmental Science
Fine Arts
Forestry and Agriculture
Life Science
Zoology
Material Type:
Activity/Lab
Data Set
Diagram/Illustration
Interactive
Author:
Wisconsin Department of Natural Resources
Date Added:
04/23/2024
Wisconsin Lakes - Water Quality Data for each lake by County
Unrestricted Use
Public Domain
Rating
0.0 stars

Volunteers, DNR staff, county staff and others collect water clarity, temperature and dissolved oxygen, as well as other water quality data, on lakes across Wisconsin. Around 1,000 volunteers are currently active, and the network has been going strong since 1986. Water clarity is measured with a black and white disk called a "Secchi Disk".

Satellite images are used to retrieve water clarity data for lakes across the state. This effort began in 1999 when the University of Wisconsin-Madison Environmental Remote Sensing Center (ERSC) developed a model for the retrieval of water clarity data from satellite images and Citizen Lake Monitoring Network volunteers provided on-the-ground Secchi data to calibrate this model for each satellite image. Water clarity data was retrieved for over 8,000 lakes statewide between 1999 and 2001. The DNR continues to analyze data in this way today in its remote sensing program.

Subject:
Agriculture, Food and Natural Resources
Biology
Career and Technical Education
Ecology
Environmental Science
Forestry and Agriculture
Life Science
Marketing, Management and Entrepreneurship
Material Type:
Data Set
Diagram/Illustration
Other
Author:
Wisconsin Department of Natural Resources
Date Added:
04/24/2024
Wisconsin Surface Water Data Viewer
Conditional Remix & Share Permitted
CC BY-NC
Rating
0.0 stars

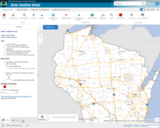
The Surface Water Data Viewer is a mapping tool for the State of Wisconsin. It provides interactive web mapping tools for a variety of datasets, including chemistry, physical, and biological data. The data managed in layers that can be turned on and off as needed. The Homepage of the Surface Water Data Viewer (SWDV) has many commonly used features labeled. Descriptions of the features are as follows:

Toolbars: There are a variety of toolbars with different themes to help complete tasks using the SWDV. The toolbars can be used to display the layers available to the map, add or remove shapes, text, or measurement features, identify points, print maps, and more!

Search Bar: Using the search bar, you can search monitoring stations by number, locations by keyword, and waterbodies by WBIC. Be careful when using the search bar, partial matches do not always appear in the results.

Navigation Pane: The navigation pane is where results will appear from searches, where you are able to select layers for the map, and features for printing. You will be able to refine the data that is shown here, if desired. You can hide the navigation pane by clicking the left-facing arrow at the top.

Coordinates and Coordinate System: The coordinates will display for any point moused-over on the map. Click the black triangle to select your preferred method for displaying lat/long (DD, DMS, DDM, Mercator). The right-most option in this pane allows you to manually manage thescale of the map. Click on the scale tool, and selected the desired scale at which you wish to view the map. Select Go to implement changes.

Scale Bar: The scale bar shows the current extent of the map.

Whole State View: This view describes what is being shown on the main map relative to the entire state. A blue rectangle will cover the region of the state being shown on the map. You can also navigate the map by moving the blue square around the state-view map. If you print a map, this whole state view will print in the corner as a reference. You can minimize this view by clicking the corner-facing arrow in the top left edge of the box.

Show/Hide Toolbar: Use this button to hide the toolbar for a larger view of the map. If you have hidden the toolbar, you can also use this button to show it again.

Subject:
Agriculture, Food and Natural Resources
American Indian Studies
Biology
Botany
Career and Technical Education
Earth and Space Science
Ecology
Education
Elementary Education
Environmental Science
Forestry and Agriculture
Geography
Geology
Higher Education
Hydrology
Life Science
Social Studies
Material Type:
Activity/Lab
Homework/Assignment
Learning Task
Lecture
Lesson
Author:
Wisconsin Department of Natural Resources
Date Added:
03/12/2024
Wisconsin Water Condition Viewer - Wisconsin DNR
Only Sharing Permitted
CC BY-NC-ND
Rating
0.0 stars

The Water Condition Viewer (WCV) is an interactive mapping tool that focuses on water condition, monitoring, assessment and management data. Data includes Clean Water Act, Monitoring Projects, Healthy Watersheds Assessments, Targeted Watershed Assessments, Wastewater Evaluation, Watershed Planning, County Land and Water Plans, Nine Key Element Plans and more. All datasets from specialized themes are available from this main, general set of layers.

Subject:
Agriculture, Food and Natural Resources
Biology
Botany
Career and Technical Education
Earth and Space Science
Ecology
Education
Elementary Education
Environmental Literacy and Sustainability
Environmental Science
Family and Consumer Sciences
Forestry and Agriculture
Geology
Health Education
Health Science
Hydrology
Life Science
Marketing, Management and Entrepreneurship
Material Type:
Activity/Lab
Homework/Assignment
Lecture
Lesson
Author:
Wisconsin Department of Natural Resources
Date Added:
03/12/2024
Wisconsin Wetland Inventory - Wetlands Data
Conditional Remix & Share Permitted
CC BY-NC
Rating
0.0 stars

The Wisconsin Wetland Inventory (WWI) regulatory maps show graphic representations of the type, size and location of wetlands in Wisconsin. These maps have been prepared from the analysis of high altitude imagery in conjunction with soil surveys, topographic maps, previous wetland inventories and field work. The Wisconsin Department of Natural Resources (DNR) manages the WWI.

The U.S. Fish and Wildlife Service (USFWS) began producing non-regulatory, polygonal, geospatial wetland maps for the United States via their National Wetlands Inventory (NWI) in the mid-1970s. While DNR does provide WWI data to USFWS, there can be a significant lag before those updates appear in the NWI.

STATEWIDE: Digital wetlands data are available from the Wisconsin DNR for the state. Alternatively, wetlands are available for free viewing as a layer in the DNR Surface Water Data Viewer.

Wisconsin Wetland Inventory Geodatabase – free download
App: Wisconsin DNR Surface Water Data Viewer

NATIONAL: The NWI is slightly more detailed than WWI since NWI also maps deep water systems including lakes, streams and rivers. The Wisconsin DNR provides their WWI data to the U.S. Fish and Wildlife service for integration into the NWI, but users should be cautioned that Wisconsin updates to NWI can reportedly take months, and in some cases years. Users requiring Wisconsin wetlands data are strongly encouraged to start with the Wisconsin Wetland Inventory.

National Wetlands Inventory Data

Subject:
Agriculture, Food and Natural Resources
Biology
Career and Technical Education
Earth and Space Science
Ecology
Environmental Literacy and Sustainability
Environmental Science
Forestry and Agriculture
Geology
Hydrology
Life Science
Material Type:
Data Set
Interactive
Reading
Reference Material
Author:
Wisconsin State Cartographer’s Office (SCO)
Date Added:
03/25/2024
Wisconsin's Fishes
Conditional Remix & Share Permitted
CC BY-NC
Rating
0.0 stars

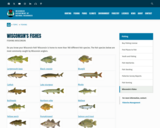
Do you know your Wisconsin fish? Wisconsin is home to more than 160 different fish species. The fish species below are most commonly caught by Wisconsin anglers.

Also links to these resources:
Wisconsin's state record fish
Hooked on Wisconsin Anglers' Club
Game fish of Wisconsin poster
Fish Wildcards - A set of 45 fish, plus games, knots, basic fish anatomy, a common fish parasite, and a handy trick to estimate your fish’s weight with a ruler! Two versions:
Match Your Catch, Low-Res Version [PDF] or
Match Your Catch, Hi-Res Version [PDF]
Fish of Wisconsin [exit DNR]
Fish identification database [exit DNR]
Burbot, bowfin and snakehead identification
Wisconsin fish species list [PDF] - a printable document with Wisconsin's fish species.

Subject:
Agriculture, Food and Natural Resources
Art and Design
Biology
Career and Technical Education
Early Learning
Ecology
Education
Elementary Education
Environmental Science
Family and Consumer Sciences
Fine Arts
Health Science
Life Science
Marketing, Management and Entrepreneurship
Media Arts
Zoology
Material Type:
Activity/Lab
Data Set
Interactive
Reference Material
Author:
Wisconsin Department of Natural Resources
Date Added:
04/21/2024
Wizardry and Chemistry
Read the Fine Print
Educational Use
Rating
0.0 stars

Students learn how common pop culture references (Harry Potter books) can relate to chemistry. While making and demonstrating their own low-intensity sparklers (muggle-versions of magic wands), students learn and come to appreciate the chemistry involved (reaction rates, Gibb's free energy, process chemistry and metallurgy). The fun part is that all wands are personalized and depend on how well students conduct the lab. Students end the activity with a class duel a face-off between wands of two different chemical compositions. This lab serves as a fun, engaging review for stoichiometry, thermodynamics, redox and kinetics, as well as advanced placement course review.

Subject:
Career and Technical Education
Chemistry
Physical Science
Technology and Engineering
Material Type:
Activity/Lab
Provider:
TeachEngineering
Provider Set:
TeachEngineering NGSS Aligned Resources
Author:
Eugene Chiappetta
Marc Bird
National Science Foundation GK-12 and Research Experience for Teachers (RET) Programs,
Date Added:
09/18/2014
Yale CHEM 125: Lecture 28 - Stereochemical Nomenclature; Racemization and Resolution (Video & Lecture Notes)
Restricted Use
Copyright Restricted
Rating
0.0 stars

Determination of the actual atomic arrangement in tartaric acid in 1949 motivated a change in stereochemical nomenclature from Fischer's 1891 genealogical convention (D, L) to the CIP scheme (R, S) based on conventional group priorities. Configurational isomers can be interconverted by racemization and epimerization. Pure enantiomers can be separated from racemic mixtures by resolution schemes based on selective crystallization of conglomerates or temporary formation of diastereomers.

Subject:
Chemistry
Physical Science
Material Type:
Lesson
Provider:
Yale
Date Added:
12/23/2015
Yale CHEM 125: Lecture 32 -  Stereotopicity and Baeyer Strain Theory (Video & Lecture Notes)
Restricted Use
Copyright Restricted
Rating
0.0 stars

Why ethane has a rotational barrier is still debatable. Analyzing conformational and configurational stereotopicity relationships among constitutionally equivalent groups reveals a subtle discrimination in enzyme reactions. When Baeyer suggested strain-induced reactivity due to distorting bond angles away from those in an ideal tetrahedron, he assumed that the cyclohexane ring is flat. He was soon corrected by clever Sachse, but Sachse's weakness in rhetoric led to a quarter-century of confusion.

Subject:
Chemistry
Physical Science
Material Type:
Lesson
Provider:
Yale
Date Added:
12/23/2015
Yale CHEM 125: Lecture 5 -  X-Ray Diffraction (Video & Lecture Notes)
Restricted Use
Copyright Restricted
Rating
0.0 stars

Professor McBride introduces the theory behind light diffraction by charged particles and its application to the study of the electron distribution in molecules by x-ray diffraction. The roles of molecular pattern and crystal lattice repetition are illustrated by shining laser light through diffraction masks to generate patterns reminiscent of those encountered in X-ray studies of ordered solids.

Subject:
Chemistry
Physical Science
Material Type:
Lesson
Provider:
Yale
Date Added:
12/23/2015
Yale CHEM 125: Lecture 6 -Seeing Bonds by Electron Difference Density (Video & Lecture Notes)
Restricted Use
Copyright Restricted
Rating
0.0 stars

Professor McBride uses a hexagonal "benzene" pattern and Franklin's X-ray pattern of DNA, to continue his discussion of X-ray crystallography by explaining how a diffraction pattern in "reciprocal space" relates to the distribution of electrons in molecules and to the repetition of molecules in a crystal lattice. He then uses electron difference density mapping to reveal bonds, and unshared electron pairs, and their shape, and to show that they are only one-twentieth as dense as would be expected for Lewis shared pairs. Anomalous difference density in the carbon-fluorine bond raises the course's second great question, "Compared to what?"

Subject:
Chemistry
Physical Science
Material Type:
Lesson
Provider:
Yale
Date Added:
12/23/2015
Your Family's Carbon Footprint
Unrestricted Use
CC BY
Rating
0.0 stars

Students investigate how much greenhouse gas (carbon dioxide and methane) their family releases into the atmosphere each year and relate it to climate change. To address this, students use the Environmental Protection Agency Personal Emissions Calculator to estimate their family's greenhouse gas emissions and to think about how their family could reduce those emissions.

Subject:
Physical Science
Material Type:
Activity/Lab
Provider:
CLEAN: Climate Literacy and Energy Awareness Network
Provider Set:
CLEAN: Climate Literacy and Energy Awareness Network
Author:
Activities for Conceptualizing Climate and Climate Change
Perdue University
Date Added:
02/07/2023
nanoHUB.org
Conditional Remix & Share Permitted
CC BY-NC-SA
Rating
0.0 stars

This site provides online simulations, learning modules, and interactive tools for learning about nanotechnology -- the design and production of structures, devices, and systems one atom or one molecule at a time. Analyze the electronic properties of different nano materials and the optical properties of nanoparticles. Explore molecular conduction, nanofluids, and nanowires. Create simulations of nanoelectronic and nanoelectromechanical systems. Registration required.

Subject:
Career and Technical Education
Technology and Engineering
Material Type:
Activity/Lab
Lecture
Lecture Notes
Simulation
Syllabus
Provider:
Purdue University
Provider Set:
nanoHUB.org
Date Added:
05/23/2006
pH Scale
Unrestricted Use
CC BY
Rating
0.0 stars

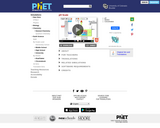
Test the pH of things like coffee, spit, and soap to determine whether each is acidic, basic, or neutral. Visualize the relative number of hydroxide ions and hydronium ions in solution. Switch between logarithmic and linear scales. Investigate whether changing the volume or diluting with water affects the pH. Or you can design your own liquid!

Subject:
Biology
Career and Technical Education
Chemistry
Education
Life Science
Mathematics
Physical Science
Physics
Technology and Engineering
Material Type:
Activity/Lab
Interactive
Simulation
Provider:
PhET
Author:
Adams, Wendy
Archie Paulson
Barbera, Jack
Chris Malley
Excellence Center of Science and Mathematics Education at King Saud University
Jack Barbera
Kathy Perkins
Landgon, Laurie
Laurie Langdon
Loeblein, Patricia
Malley, Chris
National Science Foundation
O'Donnell Foundation
Patricia Loeblein
Paulson, Archie
Perkins, Kathy
PhET
PhET Interactive Simulations
The William and Flora Hewlett Foundation
Wendy Adams
Date Added:
07/01/2008
pH Scale (AR)
Unrestricted Use
CC BY
Rating
0.0 stars

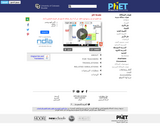
Test the pH of things like coffee, spit, and soap to determine whether each is acidic, basic, or neutral. Visualize the relative number of hydroxide ions and hydronium ions in solution. Switch between logarithmic and linear scales. Investigate whether changing the volume or diluting with water affects the pH. Or you can design your own liquid!

Subject:
Chemistry
Physical Science
Material Type:
Simulation
Provider:
University of Colorado Boulder
Provider Set:
PhET Interactive Simulations
Author:
Adams, Wendy
Barbera, Jack
Landgon, Laurie
Loeblein, Patricia
Malley, Chris
Paulson, Archie
Perkins, Kathy
Date Added:
07/02/2012