This roadtrip-themed presentation can be used to help school leaders guide their …
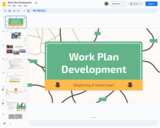
This roadtrip-themed presentation can be used to help school leaders guide their staff through the process of developing a continuous improvement work plan, aligned to EL's Three Dimensions of Student Achievement. This presentation covers two dimensions: Mastery of Knowledge and Skills and Character. This could be done over the course of one or two days, depending on the time you have available.
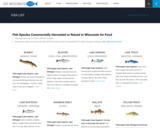
Dane County's abundant surface water resources are monitored and assessed primarily by …
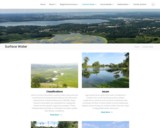
Dane County's abundant surface water resources are monitored and assessed primarily by the Wisconsin Department of Natural Resources (WDNR). Major streams and lakes are classified into categories based on the aquatic organisms present. These classifications provide an indication of water quality and fishery conditions.
Agricultural and urban land uses contribute to nutrient rich runoff reaching surface waters. Impervious surfaces and removal of wetlands also increases the flow of stormwater to local waterways. Explore issues facing our surface water and see maps of degraded water resources.
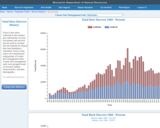
Effective water quality planning depends on long-term assessment and monitoring. The Capital Area Regional Planning Commission uses long-term datasets to evaluate regional trends.
Learn about practices meant to protect the region's streams, shorelands, and lakes.
Dane County Land and Water Resources Viewer: An interactive county map showing watershed boundaries, thermally sensitive areas, cold water communities and more.
Meet the Data Decoders—a team of scientists at the Solís-Lemus Lab who …
Meet the Data Decoders—a team of scientists at the Solís-Lemus Lab who use math and computers to interpret huge amounts of data from biological experiments.
Resources available for learning about this lab include: • Interactive cards designed to introduce students to scientists in a more personal way • A video with a personal story that explains why the lab's research matters in real life • Questions to consider that will spark connection, reflection, and conversation • An interactive video experience where you can ask questions of scientists in the lab and learn about their research • An inquiry-based activity that focuses on doing science, using some of the same science practices that the lab uses • An educator guide with information about standards alignment, curriculum connections, and tips for using the media resources
These resources are part of Meet the Lab, a collection of educational resources for middle school science classrooms.
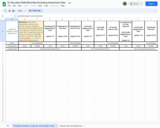
This video is the introduction of developing a simple query for students …
This video is the introduction of developing a simple query for students that already have a base knowledge of Assess layout and strong understanding of Excel. It shows an example of a simple database and how to develop a simple query and pulling out information you would want. It goes in a simple step by step format which is easy to follow and clear to understand. The follow up videos that are used follow the same type of instruction and build off one another.
Students pass around and distort messages written on index cards to learn …
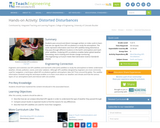
Students pass around and distort messages written on index cards to learn how we use signals from GPS occultations to study the atmosphere. The cards represent information sent from GPS satellites being distorted as they pass through different locations in the Earth's atmosphere and reach other satellites. Analyzing GPS occultations enables better global weather forecasting, storm tracking and climate change monitoring.
Once widespread here and across North America, elk were eliminated from Wisconsin …
Once widespread here and across North America, elk were eliminated from Wisconsin in the 1880s due to unregulated hunting and habitat loss. Over 130 years later, they once again live in our state's central and northern forest regions. From a population of 25 elk reintroduced in 1995, and with the help of the second reintroduction effort that started in 2015, the state's total elk population has now surpassed 400 animals.
Thanks to the support of multiple partners and the backing of Wisconsin citizens, the bugle of rutting September bulls is back and here to stay!
Elk (Cervus canadensis) is one of North America's most significant deer family members (Cervidae), second only to moose. Wisconsin's native elk (before European settlement) belonged to the Eastern elk subspecies (C. c. canadensis), believed to have gone extinct during the late 1800s. The Rocky Mountain sub-species (C. c. nelsoni) was later used in reintroduction efforts in Wisconsin and other eastern U.S. states.
Elk is one of three members of the deer family that lives in Wisconsin regularly, with the other two being white-tailed deer (Odocoileus virginianus) and moose (Alces alces). Elk are approximately three times larger than deer and about two-thirds the size of moose. Adult elk are light tan-colored with a darker mane on their neck with a distinct buff-colored rump patch and stub tail.
Elk vary in size by sex. A mature cow stands approximately four and a half feet tall at the shoulder, six and a half feet in length from nose to tail and weighs 500-650 pounds. In contrast, a mature bull may stand five feet or more at the shoulder, stretch over eight feet long and weigh 600-900 pounds. Wisconsin elk calves typically weigh between 35-40 pounds at birth. Calves are born with white spots to help them blend into their surroundings during their first few months. Elk are also a herd-associated species that have many vocalizations and unique characteristics.
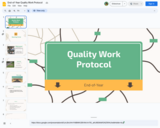
This road trip-themed presentation can be used to guide the Quality Work …
This road trip-themed presentation can be used to guide the Quality Work protocol by EL Education at the end of the school year. Using the protocol will enable students to review student work and reflect on their students' ability to create complex and authentic work and demonstrate craftsmanship as described in EL Education's Three Dimensions of Student Achievement. Teams can also use this process to guide their continuous improvement efforts.
This resource provides recommended purposes and functions of district, school, and teacher …
This resource provides recommended purposes and functions of district, school, and teacher teams engaged in meaningful continuous improvement. It also provides a blank template to document a district’s current state of linked team infrastructure. Comparing their current state to the recommended system provides an avenue to target improvement in collaboration and leadership practices.
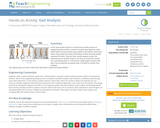
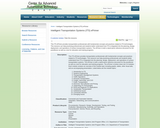
In this open-ended, hands-on activity that provides practice in engineering data analysis, …
In this open-ended, hands-on activity that provides practice in engineering data analysis, students are given gait signature metric (GSM) data for known people types (adults and children). Working in teams, they analyze the data and develop models that they believe represent the data. They test their models against similar, but unknown (to the students) data to see how accurate their models are in predicting adult vs. child human subjects given known GSM data. They manipulate and graph data in Excel® to conduct their analyses.
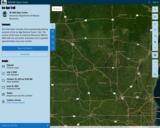
Geoscience data from the Wisconsin Geological Survey This interactive map shows locations …
Geoscience data from the Wisconsin Geological Survey This interactive map shows locations of site data for our collections of geophysical logs and Quaternary core.
Geophysical, Quaternary Core, and Rock Core Data is available from across Wisconsin.
This 10-day module builds on Grade 2 concepts about data, graphing, and …
This 10-day module builds on Grade 2 concepts about data, graphing, and line plots. The two topics in this module focus on generating and analyzing categorical and measurement data. By the end of the module, students are working with a mixture of scaled picture graphs, bar graphs, and line plots to problem solve using both categorical and measurement data.
Find the rest of the EngageNY Mathematics resources at https://archive.org/details/engageny-mathematics.
This data layer includes lines representing existing sections of the Ice Age …
This data layer includes lines representing existing sections of the Ice Age National Scenic Trail. This version of the data is hosted by Wisconsin DNR for DNR staff use and public download and is updated approximately every two months.
This layer is hosted by Wisconsin DNR, and reflects Ice Age Trail updates received from the Ice Age Trail Alliance on December 21st, 2023. This layer is typically updated approximately every two months and is primarily for the purpose of DNR staff use and public download from DNR's Open Data Portal. For more current trail data contact Tiffany Stram (tiffany@iceagetrail.org) GIS/Technology Specialist at Ice Age Trail Alliance. For the official depiction of Ice Age Trails in Wisconsin, see Ice Age Trail Alliance's Ice Age National Scenic Trail Existing Sections - Official Layer: https://www.arcgis.com/home/item.html?id=735b25ad50e74520b7396d9168f53cfc.
This data layer includes lines representing existing sections of the Ice Age National Scenic Trail. This layer is a combination of GPS and digitized data, merged to represent one complete data layer for the IAT. The data was developed by the Ice Age Trail Alliance (IATA) in cooperation with the National Park Service's Ice Age Trail Office.
Welcome to Information Systems for Business and Beyond. In this book, you …
Welcome to Information Systems for Business and Beyond. In this book, you will be introduced to the concept of information systems, their use in business, and the larger impact they are having on our world.
This book is written as an introductory text, meant for those with little or no experience with computers or information systems. While sometimes the descriptions can get a little bit technical, every effort has been made to convey the information essential to understanding a topic while not getting bogged down in detailed terminology or esoteric discussions.
Learning objectives can be found at the beginning of each chapter. Of course, all chapters are recommended for use in an introductory information systems course. However, for courses on a shorter calendar or courses using additional textbooks, a review of the learning objectives will help determine which chapters can be omitted.
At the end of each chapter, there is a set of study questions and exercises (except for chapter 1, which only offers study questions). The study questions can be assigned to help focus students’ reading on the learning objectives. The exercises are meant to be a more in-depth, experiential way for students to learn chapter topics. It is recommended that you review any exercise before assigning it, adding any detail needed (such as length, due date) to complete the assignment.
Broad coverage of technology concepts underlying modern computing and information management. Topics …
Broad coverage of technology concepts underlying modern computing and information management. Topics include computer architecture and operating systems, relational database systems, graphical user interfaces, networks, client/server systems, enterprise applications, cryptography, and the web. Hands-on exposure to internet services, Microsoft Access database management system, and Lotus Notes. Information Technology I helps students understand technical concepts underlying current and future developments in information technology. There will be a special emphasis on networks and distributed computing. Students will also gain some hands-on exposure to powerful, high-level tools for making computers do amazing things, without the need for conventional programming languages. Since 15.564 is an introductory course, no knowledge of how computers work or are programmed is assumed.
This ITS ePrimer provides transportation professionals with fundamental concepts and practices related …
This ITS ePrimer provides transportation professionals with fundamental concepts and practices related to ITS technologies. This resource can help practicing professionals and students better understand how ITS is integrated into the planning, design, deployment, and operations of surface transportation systems. The ePrimer is both a stand-alone reference document for the practitioner as well as a text for education and training programs.
No restrictions on your remixing, redistributing, or making derivative works. Give credit to the author, as required.
Your remixing, redistributing, or making derivatives works comes with some restrictions, including how it is shared.
Your redistributing comes with some restrictions. Do not remix or make derivative works.
Most restrictive license type. Prohibits most uses, sharing, and any changes.
Copyrighted materials, available under Fair Use and the TEACH Act for US-based educators, or other custom arrangements. Go to the resource provider to see their individual restrictions.