Updating search results...

Search Resources

3 Results

View
Selected filters:
  • wetland
2nd Grade Unit on Seed Dispersal, Plant Life Cycles and Pollination
Conditional Remix & Share Permitted
CC BY-NC-SA
Rating
0.0 stars

This unit focuses on the diversity of life at Hartje School Forest and centers around NGSS Standards on Ecosystem Interactions, Energy and Dynamics. Field experiences in observing and recording the diversity of life, seed dispersal methods, plant pollination, and plant life cycles will support science disciplinary core ideas, cross-cutting concepts, and hands-on engineering practices.

Subject:
Agriculture, Food and Natural Resources
Career and Technical Education
Education
Educational Technology
Elementary Education
Environmental Science
Life Science
Technology and Engineering
Material Type:
Activity/Lab
Diagram/Illustration
Formative Assessment
Interactive
Interim/Summative Assessment
Learning Task
Lesson
Lesson Plan
Module
Unit of Study
Date Added:
01/28/2019
Dane County Water Quality - Land and Water Resources Viewer - Surface Water
Only Sharing Permitted
CC BY-NC-ND
Rating
0.0 stars

Dane County's abundant surface water resources are monitored and assessed primarily by the Wisconsin Department of Natural Resources (WDNR). Major streams and lakes are classified into categories based on the aquatic organisms present. These classifications provide an indication of water quality and fishery conditions.

Agricultural and urban land uses contribute to nutrient rich runoff reaching surface waters. Impervious surfaces and removal of wetlands also increases the flow of stormwater to local waterways. Explore issues facing our surface water and see maps of degraded water resources.

Effective water quality planning depends on long-term assessment and monitoring. The Capital Area Regional Planning Commission uses long-term datasets to evaluate regional trends.

Learn about practices meant to protect the region's streams, shorelands, and lakes.

Dane County
Land and Water Resources Viewer: An interactive county map showing watershed boundaries, thermally sensitive areas, cold water communities and more.

Subject:
Agriculture, Food and Natural Resources
Biology
Botany
Career and Technical Education
Civics and Government
Earth and Space Science
Ecology
Education
Elementary Education
Environmental Literacy and Sustainability
Environmental Science
Family and Consumer Sciences
Forestry and Agriculture
Geology
Health Education
Health Science
Higher Education
Hydrology
Life Science
Social Studies
Material Type:
Activity/Lab
Homework/Assignment
Learning Task
Author:
The Capital Regional Planning Commission
Date Added:
03/12/2024
Wisconsin Surface Water Data Viewer
Only Sharing Permitted
CC BY-NC-ND
Rating
0.0 stars

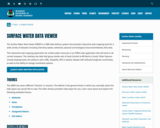
The Surface Water Data Viewer is a mapping tool for the State of Wisconsin. It provides interactive web mapping tools for a variety of datasets, including chemistry, physical, and biological data. The data managed in layers that can be turned on and off as needed. The Homepage of the Surface Water Data Viewer (SWDV) has many commonly used features labeled. Descriptions of the features are as follows:

Toolbars: There are a variety of toolbars with different themes to help complete tasks using the SWDV. The toolbars can be used to display the layers available to the map, add or remove shapes, text, or measurement features, identify points, print maps, and more!

Search Bar: Using the search bar, you can search monitoring stations by number, locations by keyword, and waterbodies by WBIC. Be careful when using the search bar, partial matches do not always appear in the results.

Navigation Pane: The navigation pane is where results will appear from searches, where you are able to select layers for the map, and features for printing. You will be able to refine the data that is shown here, if desired. You can hide the navigation pane by clicking the left-facing arrow at the top.

Coordinates and Coordinate System: The coordinates will display for any point moused-over on the map. Click the black triangle to select your preferred method for displaying lat/long (DD, DMS, DDM, Mercator). The right-most option in this pane allows you to manually manage thescale of the map. Click on the scale tool, and selected the desired scale at which you wish to view the map. Select Go to implement changes.

Scale Bar: The scale bar shows the current extent of the map.

Whole State View: This view describes what is being shown on the main map relative to the entire state. A blue rectangle will cover the region of the state being shown on the map. You can also navigate the map by moving the blue square around the state-view map. If you print a map, this whole state view will print in the corner as a reference. You can minimize this view by clicking the corner-facing arrow in the top left edge of the box.

Show/Hide Toolbar: Use this button to hide the toolbar for a larger view of the map. If you have hidden the toolbar, you can also use this button to show it again.

Subject:
Agriculture, Food and Natural Resources
American Indian Studies
Biology
Botany
Career and Technical Education
Earth and Space Science
Ecology
Education
Elementary Education
Environmental Science
Forestry and Agriculture
Geography
Geology
Higher Education
Hydrology
Life Science
Social Studies
Material Type:
Activity/Lab
Homework/Assignment
Learning Task
Lecture
Lesson
Author:
Wisconsin Department of Natural Resources
Date Added:
03/12/2024