The Invasive Plants Association of Wisconsin (IPAW) is a nonprofit membership-based organization …
The Invasive Plants Association of Wisconsin (IPAW) is a nonprofit membership-based organization whose mission is to promote better stewardship of the natural resources of Wisconsin by advancing the understanding of invasive plants, preventing their introduction, and encouraging the control of their spread.
IPAW defines an invasive plant as one that invades native plant communities and impacts those native communities by displacing or replacing native vegetation.
Both a weed and an invasive plant are plants out of place, but an invasive plant encroaches into forests, roadsides, and prairies where it is unchecked by the devotions of an obsessive backyard gardener. The ramifications of invasive plants are so much more ominous than that of weeds because they can and do destroy the natural diversity of native vegetation.
Ironically, many invasive plants get their foothold through well-meaning gardeners who introduce the species as a lovely accent to their patch of paradise. However, many of these plants come from foreign lands and do not have the natural controls that a native plant has. Soon the nonnative plant takes over – first the garden and then, by propagating via the wind, through deep-set runners and by the cooperation of willing birds carrying the seeds, more distant places.
There are many plants that are invasive in Wisconsin. To ease you into an awareness of invasive plants without overwhelming you, IPAW has developed this list of Wisconsin’s Worst foreign invaders.
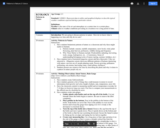
This road trip-themed presentation can be used to guide the Quality Work …
This road trip-themed presentation can be used to guide the Quality Work protocol by EL Education. Using the protocol will enable students to review student work and reflect on their students' ability to create complex and authentic work and demonstrate craftsmanship as described in EL Education's Three Dimensions of Student Achievement. Teams can also use this process to guide their continuous improvement efforts.
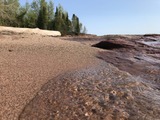
In high school, Gena and Ali set out to learn about the …
In high school, Gena and Ali set out to learn about the geophysical forces acting on Lake Superior. They wanted to investigate why they would sometimes see such dramatic fluctuations in Lake Superior water levels. They learned that large lakes exhibit a phenomenon called a seiche (pronounced saysh) and they decided to investigate how often the water switched directions and how much the water level changed because of the seiche.
This activity was evaluated using the HQIM rubric linked here https://docs.google.com/spreadsheets/d/1hZqpmXhKFV1ltE8PbdtFJzRvwcvdA-bDQ_-Kw29cci8/edit?usp=sharing
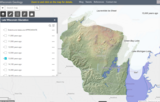
This arc GIS application interactive layer shows the stages of glacial ice …
This arc GIS application interactive layer shows the stages of glacial ice locations across Wisconsin from 32,000 to 11,000 years before present. Shows subsequent impacts of glacial activity to form moraines, eskers, kames, and other glacial features including glacial melting to form glacial lakes and features across Wisconsin.
Series of 43 page-size maps showing the chronology of the last glaciation's …
Series of 43 page-size maps showing the chronology of the last glaciation's advances and retreats across Wisconsin. Includes a brief discussion about how the maps were made, how lake positions were determined, as well as a list of selected references.
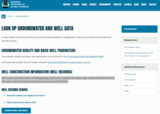
Wisconsin DNR link to look up most private or public wells. Can …
Wisconsin DNR link to look up most private or public wells. Can use Map View or by unique Well ID number. Well construction information, including geology, construction method, well depth, water depth, well yield and other information about the well.
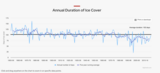
Observational data set since 1855 from both Madison area lakes Mendota and …
Observational data set since 1855 from both Madison area lakes Mendota and Monona from the Wisconsin State Climatology Office and Nelson Institute for Environmental Studies
In this math lesson, learners discover a powerful way to display dataäóîusing …
In this math lesson, learners discover a powerful way to display dataäóîusing a glyph. Learners create glyphs by drawing their own faces on paper plates. Making a glyph involves the logical skill of classification--a learner must decide which groups he or she belongs to in order to complete the picture. This lesson guide includes questions for learners, assessment options, extensions, and reflection questions.
This course was originally developed for the Open Course Library project. The …
This course was originally developed for the Open Course Library project. The text used is Math in Society, edited by David Lippman, Pierce College Ft Steilacoom. Development of this book was supported, in part, by the Transition Math Project and the Open Course Library Project. Topics covered in the course include problem solving, voting theory, graph theory, growth models, finance, data collection and description, and probability.
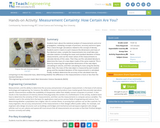
Students learn about the statistical analysis of measurements and error propagation, reviewing …
Students learn about the statistical analysis of measurements and error propagation, reviewing concepts of precision, accuracy and error types. This is done through calculations related to the concept of density. Students work in teams to each measure the dimensions and mass of five identical cubes, compile the measurements into small data sets, calculate statistics including the mean and standard deviation of these measurements, and use the mean values of the measurements to calculate density of the cubes. Then they use this calculated density to determine the mass of a new object made of the same material. This is done by measuring the appropriate dimensions of the new object, calculating its volume, and then calculating its mass using the density value. Next, the mass of the new object is measured by each student group and the standard deviation of the measurements is calculated. Finally, students determine the accuracy of the calculated mass by comparing it to the measured mass, determining whether the difference in the measurements is more or less than the standard deviation.
Wisconsin's Meteorites dataset collection of all of the known locations of meteorites, …
Wisconsin's Meteorites dataset collection of all of the known locations of meteorites, plus known craters formed from larger meteorites, including the Rock Elm Disturbance found in West Central Wisconsin.
(Nota: Esta es una traducción de un recurso educativo abierto creado por …
(Nota: Esta es una traducción de un recurso educativo abierto creado por el Departamento de Educación del Estado de Nueva York (NYSED) como parte del proyecto "EngageNY" en 2013. Aunque el recurso real fue traducido por personas, la siguiente descripción se tradujo del inglés original usando Google Translate para ayudar a los usuarios potenciales a decidir si se adapta a sus necesidades y puede contener errores gramaticales o lingüísticos. La descripción original en inglés también se proporciona a continuación.)
Este módulo de 10 días se basa en conceptos de grado 2 sobre datos, gráficos y parcelas de línea. Los dos temas en este módulo se centran en generar y analizar datos categóricos y de medición. Al final del módulo, los estudiantes están trabajando con una mezcla de gráficos de imágenes escalados, gráficos de barras y gráficos de línea para resolver problemas utilizando datos categóricos y de medición.
Encuentre el resto de los recursos matemáticos de Engageny en https://archive.org/details/engageny-mathematics.
English Description: This 10-day module builds on Grade 2 concepts about data, graphing, and line plots. The two topics in this module focus on generating and analyzing categorical and measurement data. By the end of the module, students are working with a mixture of scaled picture graphs, bar graphs, and line plots to problem solve using both categorical and measurement data.
Find the rest of the EngageNY Mathematics resources at https://archive.org/details/engageny-mathematics.
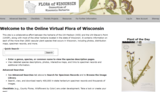
This site is a collaborative effort between the herbaria of the UW-Madison …
This site is a collaborative effort between the herbaria of the UW-Madison (WIS) and the UW-Steven's Point (UWSP), along with most of the other herbaria located in the state of Wisconsin. It contains information on each of the more than 2600 vascular plant species that occurs in Wisconsin, including photos, distribution maps, specimen records, and more.
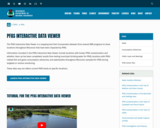
The PFAS Interactive Data Viewer is a mapping tool that incorporates datasets …
The PFAS Interactive Data Viewer is a mapping tool that incorporates datasets from several DNR programs to show locations throughout Wisconsin that have been impacted by PFAS.
Information included in the PFAS Interactive Data Viewer include locations with known PFAS contamination and whether clean up has been completed; results from testing municipal drinking water for PFAS; locations with PFAS-related fish and game consumption advisories; and waterbodies throughout Wisconsin sampled for PFAS during targeted or routine monitoring.
These data may not reflect current PFAS levels at specific locations.
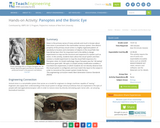
Vision is the primary sense of many animals and much is known …
Vision is the primary sense of many animals and much is known about how vision is processed in the mammalian nervous system. One distinct property of the primary visual cortex is a highly organized pattern of sensitivity to location and orientation of objects in the visual field. But how did we learn this? An important tool is the ability to design experiments to map out the structure and response of a system such as vision. In this activity, students learn about the visual system and then conduct a model experiment to map the visual field response of a Panoptes robot. (In Greek mythology, Argus Panoptes was the "all-seeing" watchman giant with 100 eyes.) A simple activity modification enables a true black box experiment, in which students do not directly observe how the visual system is configured, and must match the input to the output in order to reconstruct the unseen system inside the box.
In this lesson, students will compare weather and climate, explain patterns over …
In this lesson, students will compare weather and climate, explain patterns over time and make observations by creating a rain gauge.
NGSS: 3-ESS2-1
Time: 55 minutes
Materials: laminated patterns in nature photos (photos included), thermometer for the class, duct tape, data sheet, rulers, sharpies, scissors, empty soda bottles for rain gauages, pebbles
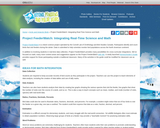
The goals of the International OER Exchange Pilot project are to: facilitate …
The goals of the International OER Exchange Pilot project are to: facilitate the development and use of Open Educational Resources (OER) by teachers and students globally, track the development and use of the science learning materials and data collection, especially around climate change study, created in the project through OER Commons, and highlight the process and results through workshops and conference presentations.The broader purpose of the project is to support the international exchange of information and understanding through freely available resources among teachers and students, especially in the area of environmental science and climate change investigation.
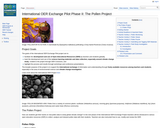
This article discusses Project FeederWatch, a real-time citizen science project, and how …
This article discusses Project FeederWatch, a real-time citizen science project, and how elementary teachers can use this bird data to integrate math lessons and concepts.
Biodiversity is a shortened form of the term "biological diversity." The entire …
Biodiversity is a shortened form of the term "biological diversity." The entire spectrum of life forms and the many ecological processes support them. Wisconsin is blessed with abundant biodiversity. Located at the junction of the eastern deciduous forest, northern boreal forest and temperate grasslands, we have a wealth of species and natural communities.
Approximately 1,800 species of native plants and close to 700 species of native vertebrates have been identified in Wisconsin. In addition, there are thousands of species of non-vascular plants and invertebrates. These pages highlight the uncommon and rare species, natural communities, geological features and essential habitat areas throughout Wisconsin.
No restrictions on your remixing, redistributing, or making derivative works. Give credit to the author, as required.
Your remixing, redistributing, or making derivatives works comes with some restrictions, including how it is shared.
Your redistributing comes with some restrictions. Do not remix or make derivative works.
Most restrictive license type. Prohibits most uses, sharing, and any changes.
Copyrighted materials, available under Fair Use and the TEACH Act for US-based educators, or other custom arrangements. Go to the resource provider to see their individual restrictions.