This is an activity about the period of the Sun's rotation. Learners …
This is an activity about the period of the Sun's rotation. Learners will use image of the Sun from the SOHO spacecraft and a transparent latitude/ longitude grid called a Stonyhurst Disk to track the motion of sunspots in terms of degrees of longitude. Using this angular motion measurement, learners will then calculate the sunspot’s angular velocity in order to determine the rotation period of the Sun. This activity requires access to the internet to obtain images from the SOHO image archive. This is Activity 4 of the Space Weather Forecast curriculum.
Wisconsin's Meteorites dataset collection of all of the known locations of meteorites, …
Wisconsin's Meteorites dataset collection of all of the known locations of meteorites, plus known craters formed from larger meteorites, including the Rock Elm Disturbance found in West Central Wisconsin.
Climate change is causing significant degradation to the Mississippi River ecosystem. Increased …
Climate change is causing significant degradation to the Mississippi River ecosystem. Increased water and sediment delivery are making maintenance of the navigation channel difficult and diminishing the quality and quantity of critical backwater habitat. Adaptation to these changing conditions requires optimizing connection between channels and backwater habitat, creating deep water refugia in backwaters, planning for increased navigation channel dredging, and making strategic infrastructure retrofits. Many successful adaptations have been implemented on the Mississippi River, but more are needed to keep pace with the rate of ecosystem degradation resulting from climate change.
In this activity, students pose several hypotheses for what will happen if …
In this activity, students pose several hypotheses for what will happen if you continue heating or supplying energy to the hot and cold planet models (Mercury, Mars, Venus, and Earth) and then test their hypotheses using a spreadsheet based radiation balance model. The activity supports investigation of a real world challenge, experimenting with life support conditions for Mars at an Arctic outpost. The interactive model runs are conducted using a Java applet. This resource includes student worksheets, assessment questions and a teacher's guide. This is Activity B in module 2, Modeling hot and cold planets, of the resource, Earth Climate Course: What Determines a Planet's Climate? The course aims to help students to develop an understanding of our environment as a system of human and natural processes that result in changes that occur over various space and time scales.
This is an activity about solar rotation and sunspot motion. Learners will …
This is an activity about solar rotation and sunspot motion. Learners will use a sphere or ball to model the Sun and compare the observed lateral motion of sunspots to their line-of-sight motion. This is Activity 1 of the Space Weather Forecast curriculum.
In this online, interactive module, students learn how enhanced Earth remote-sensing capabilities …
In this online, interactive module, students learn how enhanced Earth remote-sensing capabilities are used by dozens of satellites that are continuously collecting data from multiple vantage points. This allows scientists from different countries to transcend political and geographical boundaries by sharing data and ideas towards the common mission of caring for planet Earth. The module is part of an online course for grades 7-12 in satellite meteorology, which includes 10 interactive modules. The site also includes lesson plans developed by teachers and links to related resources. Each module is designed to serve as a stand-alone lesson, however, a sequential approach is recommended. Designed to challenge students through the end of 12th grade, middle school teachers and students may choose to skim or skip a few sections.
This assignment uses a computer simulation of fruit fly genetics to have …
This assignment uses a computer simulation of fruit fly genetics to have students design and interpret monohybrid crosses of a trait with simple dominant and recessive alleles. Detailed instructions with animated examples, background material, a sample report and a rubric are included.
These are source data and an article from the Journal "Nature" to …
These are source data and an article from the Journal "Nature" to use with students for anchoring the effects of Global Climate change on ice durations of local lakes. The article describes ice conditions and methadologies of 6 Wisconsin Lakes. There are links to raw data that can be used to generate graphs and develop sensemaking for students.
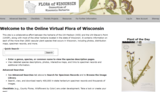
This site is a collaborative effort between the herbaria of the UW-Madison …
This site is a collaborative effort between the herbaria of the UW-Madison (WIS) and the UW-Steven's Point (UWSP), along with most of the other herbaria located in the state of Wisconsin. It contains information on each of the more than 2600 vascular plant species that occurs in Wisconsin, including photos, distribution maps, specimen records, and more.
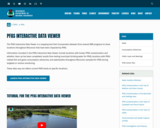
The PFAS Interactive Data Viewer is a mapping tool that incorporates datasets …
The PFAS Interactive Data Viewer is a mapping tool that incorporates datasets from several DNR programs to show locations throughout Wisconsin that have been impacted by PFAS.
Information included in the PFAS Interactive Data Viewer include locations with known PFAS contamination and whether clean up has been completed; results from testing municipal drinking water for PFAS; locations with PFAS-related fish and game consumption advisories; and waterbodies throughout Wisconsin sampled for PFAS during targeted or routine monitoring.
These data may not reflect current PFAS levels at specific locations.
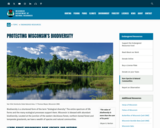
Biodiversity is a shortened form of the term "biological diversity." The entire …
Biodiversity is a shortened form of the term "biological diversity." The entire spectrum of life forms and the many ecological processes support them. Wisconsin is blessed with abundant biodiversity. Located at the junction of the eastern deciduous forest, northern boreal forest and temperate grasslands, we have a wealth of species and natural communities.
Approximately 1,800 species of native plants and close to 700 species of native vertebrates have been identified in Wisconsin. In addition, there are thousands of species of non-vascular plants and invertebrates. These pages highlight the uncommon and rare species, natural communities, geological features and essential habitat areas throughout Wisconsin.
The programming language Python is widely used within many scientific domains nowadays …
The programming language Python is widely used within many scientific domains nowadays and the language is readily accessible to scholars from the Humanities. Python is an excellent choice for dealing with (linguistic as well as literary) textual data, which is so typical of the Humanities. In this book you will be thoroughly introduced to the language and be taught to program basic algorithmic procedures. The book expects no prior experience with programming, although we hope to provide some interesting insights and skills for more advanced programmers as well. The book consists of 10 chapters. Chapter 5 and Chapter 6 are still in draft status and not ready for use.
This is an activity about assessing magnetic activity on the Sun as …
This is an activity about assessing magnetic activity on the Sun as astronomers do. Learners will select and compare five visible light solar images and identify and label each individual sunspot group. Then, learners will count all possible sunspots from each group and use both counts in a standard equation to calculate the Relative Sunspot Number for each respective solar image. This activity requires access to the internet to obtain images from the SOHO image archive. This is Activity 8 of the Space Weather Forecast curriculum.
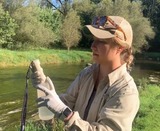
This is a Data Nugget that features Lexi Passante from the University …
This is a Data Nugget that features Lexi Passante from the University of Wisconsin-Milwaukee. She shares her data on the impact of road salt on ecosystems near paved roads in Wisconsin. Salt is applied to roads in snowy climates to help keep them safe during the winter. When the snow melts, salt makes its way into local rivers. Halophiles, or bacteria that thrive in salty conditions might be a good indicator of how much salt is in a particular waterway, telling scientists when certain areas have become too polluted with salt.
This resource has been reviewed using the HQIM rubric https://docs.google.com/spreadsheets/d/1LYgn6VNpvgX7yZQV5UGzHMQVJO8Y0TKkKjZAA4j4WI4/edit?usp=sharing
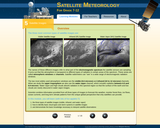
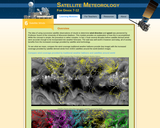
In this online, interactive module, students learn about the three types of …
In this online, interactive module, students learn about the three types of satellite images (visible, infrared, and water vapor); how to identify basic cloud types and storm systems in satellite images; and demonstrate the basic knowledge necessary to interpret satellite observations. The module is part of an online course for grades 7-12 in satellite meteorology, which includes 10 interactive modules. The site also includes lesson plans developed by teachers and links to related resources. Each module is designed to serve as a stand-alone lesson, however, a sequential approach is recommended. Designed to challenge students through the end of 12th grade, middle school teachers and students may choose to skim or skip a few sections.
In this online, interactive module, students learn about the using successive satellite …
In this online, interactive module, students learn about the using successive satellite observations of clouds to determine wind direction and speed. The module is part of an online course for grades 7-12 in satellite meteorology, which includes 10 interactive modules. The site also includes lesson plans developed by teachers and links to related resources. Each module is designed to serve as a stand-alone lesson, however, a sequential approach is recommended. Designed to challenge students through the end of 12th grade, middle school teachers and students may choose to skim or skip a few sections.
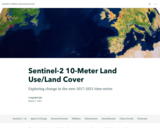
The Sentinel-2 10m Land Use/Land Cover time-series is live on ArcGIS Living …
The Sentinel-2 10m Land Use/Land Cover time-series is live on ArcGIS Living Atlas of the World! This map provides an annual assessment of yearly global land cover from 2017–2021, in 9 different land cover classes, at 10-meter resolution. The new time-series animates the natural and anthropogenic processes that continue to transform our planet's landscapes and resources, giving researchers, planners, and the GIS community the information they need to make critical future decisions.
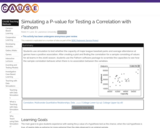
This activity has students use Fathom to test the correlation between attendance …
This activity has students use Fathom to test the correlation between attendance and ballpark capacity of major league baseball teams by taking a sample of actual data and scrambling one of the variables to see how the correlation behaves when the variables are not related. After displaying the distribution of correlations for many simulated samples, students find an approximate p-value based on the number of simulations that exceed the actual correlation.
No restrictions on your remixing, redistributing, or making derivative works. Give credit to the author, as required.
Your remixing, redistributing, or making derivatives works comes with some restrictions, including how it is shared.
Your redistributing comes with some restrictions. Do not remix or make derivative works.
Most restrictive license type. Prohibits most uses, sharing, and any changes.
Copyrighted materials, available under Fair Use and the TEACH Act for US-based educators, or other custom arrangements. Go to the resource provider to see their individual restrictions.