This activity is a field investigation in which students will gather data …
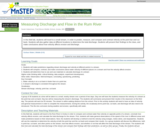
This activity is a field investigation in which students will gather data from a stream to calculate the discharge. They will need to interpret their findings and examine what factors could change the discharge of a stream over time.
This activity is a interdisciplinary field investigation where students will form observations …
This activity is a interdisciplinary field investigation where students will form observations and make calculations about stream characteristics and stream flow.
This is a field investigation where students will gather data about the …
This is a field investigation where students will gather data about the South Crow River using techniques of their own design and develop a group (multimedia) presentation for class presentation.
This activity is an outdoor lab in which students investigate the process …
This activity is an outdoor lab in which students investigate the process of evaporation, record their findings, and use the data to make connections to the environment around them.
In this science activity, students investigate the water cycle by testing the …
In this science activity, students investigate the water cycle by testing the water evaporated from leaves (transpiration) in a field experience. Students use elements of this information to track the water cycle through it's various stages.
In this activity students collect snow in a cup, predict how much …
In this activity students collect snow in a cup, predict how much water will be in the cup when the snow melts. Students are exposed to evaporation as the water "disappears" over time and try to stop this from happening.
Through multi-trial experiments, students are able to see and measure something that …
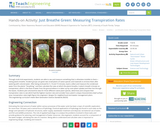
Through multi-trial experiments, students are able to see and measure something that is otherwise invisible to them seeing plants breathe. Student groups are given two small plants of native species and materials to enclose them after watering with colored water. After being enclosed for 5, 10 and 15 minutes, teams collect and measure the condensed water from the plants' "breathing," and then calculate the rates at which the plants breathe. A plant's breath is known as transpiration, which is the flow of water from the ground where it is taken up by roots (plant uptake) and then lost through the leaves. Students plot volume/time data for three different native plant species, determine and compare their transpiration rates to see which had the highest reaction rate and consider how a plant's unique characteristics (leaf surface area, transpiration rate) might figure into engineers' designs for neighborhood stormwater management plans.
Series of 43 page-size maps showing the chronology of the last glaciation's …
Series of 43 page-size maps showing the chronology of the last glaciation's advances and retreats across Wisconsin. Includes a brief discussion about how the maps were made, how lake positions were determined, as well as a list of selected references.
This resource focuses on acid rain, the effects of acid rain on …
This resource focuses on acid rain, the effects of acid rain on the ecosystems, humans, and materials as well as what people can do to help. This resource has a history timeline of the Acid Rain Program, 9 experiments, various activities, and games/puzzles with answer keys to all materials as well.
This resource is a flexible lesson plan focusing on water pollution and …
This resource is a flexible lesson plan focusing on water pollution and the causes and sources of water pollution. This lesson plan contains directions, teacher advice, concept map, worksheets, and a Powerpoint presentation as resources.
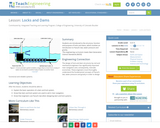
Students are introduced to the structure, function and purpose of locks and …
Students are introduced to the structure, function and purpose of locks and dams, which involves an introduction to Pascal's law, water pressure and gravity.
Wisconsin DNR link to look up most private or public wells. Can …
Wisconsin DNR link to look up most private or public wells. Can use Map View or by unique Well ID number. Well construction information, including geology, construction method, well depth, water depth, well yield and other information about the well.
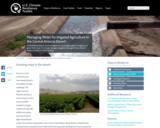
In the Arizona desert, farmers depend on an ample supply of irrigation …
In the Arizona desert, farmers depend on an ample supply of irrigation to grow their crops. As climate changes, irrigation managers face a host of issues to keep the water flowing.
This stream field investigation will allow students to look at stream erosional …
This stream field investigation will allow students to look at stream erosional patterns, take measurements to determine discharge, and conduct a chemical and turbidity analysis of Garvin Brook in Stockton, MN. Based on this investigation students will create a presentation that includes a new testable question that may be carried out the following year along with a stream ecology study.
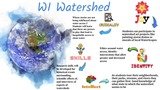
This unit will examine the scientific concepts of water cycle and watersheds. …
This unit will examine the scientific concepts of water cycle and watersheds. It will also go into historical events that have contributed to increased access to clean water as well as crises that exist around the world. We will explore the question ‘is water is a right’ and explore if it should be a shared societal priority to keep it clean. Finally, students will advocate for the importance of caring for and cleaning the water around us.
Students explore how different materials (sand, gravel, lava rock) with different water …
Students explore how different materials (sand, gravel, lava rock) with different water contents on different slopes result in landslides of different severity. They measure the severity by how far the landslide debris extends into model houses placed in the flood plain. This activity is a small-scale model of a debris chute currently being used by engineers and scientists to study landslide characteristics. Much of this activity setup is the same as for the Survive That Tsunami activity in Lesson 5 of the Natural Disasters unit.
This unit is to be taught as an extension to the FOSS …
This unit is to be taught as an extension to the FOSS WATER INVESTIGATION 1, Part 3, WATER ON A SLOPE. After learning that water flows down a slope, students will understand that this concept determines how our watersheds flow. It will also explain why some rivers (such as the Red River) appear to be flowing "up" on a map. They will then create a landform map of Minnesota accurately representing the higher elevations (our RIDGELINES) and the location of our major rivers and bodies of water. This unit can also be extended by many of the activities in the Project Wild and the MinnAqua Lesson Books.
No restrictions on your remixing, redistributing, or making derivative works. Give credit to the author, as required.
Your remixing, redistributing, or making derivatives works comes with some restrictions, including how it is shared.
Your redistributing comes with some restrictions. Do not remix or make derivative works.
Most restrictive license type. Prohibits most uses, sharing, and any changes.
Copyrighted materials, available under Fair Use and the TEACH Act for US-based educators, or other custom arrangements. Go to the resource provider to see their individual restrictions.