Measuring the dimensions of nano-circuits requires an expensive, high-resolution microscope with integrated …
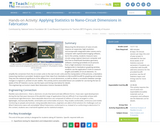
Measuring the dimensions of nano-circuits requires an expensive, high-resolution microscope with integrated video camera and a computer with sophisticated imaging software, but in this activity, students measure nano-circuits using a typical classroom computer and (the free-to-download) GeoGebra geometry software. Inserting (provided) circuit pictures from a high-resolution microscope as backgrounds in GeoGebra's graphing window, students use the application's tools to measure lengths and widths of circuit elements. To simplify the conversion from the on-screen units to the real circuits' units and the manipulation of the pictures, a GeoGebra measuring interface is provided. Students export their data from GeoGebra to Microsoft® Excel® for graphing and analysis. They test the statistical significance of the difference in circuit dimensions, as well as obtain a correlation between average changes in original vs. printed circuits' widths. This activity and its associated lesson are suitable for use during the last six weeks of the AP Statistics course; see the topics and timing note below for details.
This textbook was written for a community college introductory course in spreadsheets …
This textbook was written for a community college introductory course in spreadsheets utilizing Microsoft Excel. While the figures shown utilize Excel 2016, the textbook was written to be applicable to other versions of Excel as well. The book introduces new users to the basics of spreadsheets and is appropriate for students in any major who have not used Excel before.
Soft Skills course FREE teacher resources and trial access to online course solution …
Soft Skills course FREE teacher resources and trial access to online course solution as well as a correlation to WI state standards (WCCTS). Resources available for:-Professionalism-Teamwork & Team Building-Problem Solving & Decision Making-Verbal Communication-Oral Communication
This video demonstrates the use of both relative and absolute cell references …
This video demonstrates the use of both relative and absolute cell references in Excel, applies their use to formulas, and shows how to fill the formulas into adjacent cells.
This video demonstrates how to use simple addition, subtraction, multiplication, and division …
This video demonstrates how to use simple addition, subtraction, multiplication, and division formulas in Excel 20 and how to fill them to adjacent cells.
Students learn how to use and graph real-world stream gage data to …
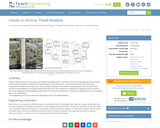
Students learn how to use and graph real-world stream gage data to create event and annual hydrographs and calculate flood frequency statistics. Using an Excel spreadsheet of real-world event, annual and peak streamflow data, they manipulate the data (converting units, sorting, ranking, plotting), solve problems using equations, and calculate return periods and probabilities. Prompted by worksheet questions, they analyze the runoff data as engineers would. Students learn how hydrographs help engineers make decisions and recommendations to community stakeholders concerning water resources and flooding.
The learning of linear functions is pervasive in most algebra classrooms. Linear …
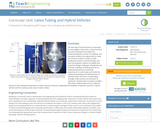
The learning of linear functions is pervasive in most algebra classrooms. Linear functions are vital in laying the foundation for understanding the concept of modeling. This unit gives students the opportunity to make use of linear models in order to make predictions based on real-world data, and see how engineers address incredible and important design challenges through the use of linear modeling. Student groups act as engineering teams by conducting experiments to collect data and model the relationship between the wall thickness of the latex tubes and their corresponding strength under pressure (to the point of explosion). Students learn to graph variables with linear relationships and use collected data from their designed experiment to make important decisions regarding the feasibility of hydraulic systems in hybrid vehicles and the necessary tube size to make it viable.
Students use latex tubes and bicycle pumps to conduct experiments to gather …
Students use latex tubes and bicycle pumps to conduct experiments to gather data about the relationship between latex strength and air pressure. Then they use this data to extrapolate latex strength to the size of latex tubing that would be needed in modern passenger sedans to serve as hybrid vehicle accelerators, thus answering the engineering design challenge question posed in the first lesson of this unit. Students input data into Excel spreadsheets and generate best fit lines by the selection of two data points from their experimental research data. They discuss the y-intercept and slope as it pertains to the mathematical model they generated. Students use the slope of the line to interpret the data collected. Then they extrapolate with this information to predict the latex dimensions that would be required for a full-size hydraulic accumulator installed in a passenger vehicle.
The following assessments and rubrics are valuable to assess knowledge in an …
The following assessments and rubrics are valuable to assess knowledge in an introductory Microsoft Office course (Word, Excel, PowerPoint, and Access).
Created by Laura Schoenike, Menomonee Falls High School
This assignment is designed for a personal finance class. Students will be …
This assignment is designed for a personal finance class. Students will be split up into groups and are to plan weddings for their assigned couple. There are four different customers that will need to be assigned. Students are to create a professional presentation using a spreadsheet application outlining their plans for their assigned customers. The purpose of the assignment is to visually see the different costs that are involved while planning for a wedding.
Suggested columns: Item description, photo of item, cost involved, and a running balance to visually show the grand total.
Business Applications and Digital Literacy course FREE teacher resources and trial access to …
Business Applications and Digital Literacy course FREE teacher resources and trial access to online course solution as well as a correlation to WI state BIT standards for business applications. Resources mapped to MOS certification.
Use this spreadsheet after students have been taught the basics of spreadsheets: …
Use this spreadsheet after students have been taught the basics of spreadsheets: entering and editing data, formatting a spreadsheet, basic functions, sorting, creating and formatting charts. Students use Skittles (can also use M&Ms or another candy or type of food with different colors that can be sorted) to create a spreadsheet. They will sort the data, create functions to analyze the data, and insert a chart.
Students are introduced to the technology of flexible circuits, some applications and …
Students are introduced to the technology of flexible circuits, some applications and the photolithography fabrication process. They are challenged to determine if the fabrication process results in a change in the circuit dimensions since, as circuits get smaller and smaller (nano-circuits), this could become very problematic. The lesson prepares students to conduct the associated activity in which they perform statistical analysis (using Excel® and GeoGebra) to determine if the circuit dimension sizes before and after fabrication are in fact statistically different. A PowerPoint® presentation and post-quiz are provided. This lesson and its associated activity are suitable for use during the last six weeks of the AP Statistics course; see the topics and timing note for details.
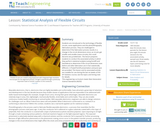
Students apply pre-requisite statistics knowledge and concepts learned in an associated lesson …
Students apply pre-requisite statistics knowledge and concepts learned in an associated lesson to a real-world state-of-the-art research problem that asks them to quantitatively analyze the effectiveness of different cracked steel repair methods. As if they are civil engineers, students statistically analyze and compare 12 sets of experimental data from seven research centers around the world using measurements of central tendency, five-number summaries, box-and-whisker plots and bar graphs. The data consists of the results from carbon-fiber-reinforced polymer patched and unpatched cracked steel specimens tested under the same stress conditions. Based on their findings, students determine the most effective cracked steel repair method, create a report, and present their results, conclusions and recommended methods to the class as if they were presenting to the mayor and city council. This activity and its associated lesson are suitable for use during the last six weeks of the AP Statistics course; see the topics and timing note for details.
Create a basic spreadsheet adding in formulas to calculate shopping expenses. Given …
Create a basic spreadsheet adding in formulas to calculate shopping expenses. Given a set budget, students must "shop" for items, with some restrictions. Bonus points are given for spending down to less than five cents.
Students build on their existing air quality knowledge and a description of …
Students build on their existing air quality knowledge and a description of a data set to each develop a hypothesis around how and why air pollutants vary on a daily and seasonal basis. Then they are guided by a worksheet through an Excel-based analysis of the data. This includes entering formulas to calculate statistics and creating plots of the data. As students complete each phase of the analysis, reflection questions guide their understanding of what new information the analysis reveals. At activity end, students evaluate their original hypotheses and “put all of the pieces together.” The activity includes one carbon dioxide worksheet/data set and one ozone worksheet/data set; providing students and/or instructors with a content option. The activity also serves as a good standalone introduction to using Excel.
No restrictions on your remixing, redistributing, or making derivative works. Give credit to the author, as required.
Your remixing, redistributing, or making derivatives works comes with some restrictions, including how it is shared.
Your redistributing comes with some restrictions. Do not remix or make derivative works.
Most restrictive license type. Prohibits most uses, sharing, and any changes.
Copyrighted materials, available under Fair Use and the TEACH Act for US-based educators, or other custom arrangements. Go to the resource provider to see their individual restrictions.