Stage 1: Digging Into the Data addresses the question “Do disparities in …
Stage 1: Digging Into the Data addresses the question “Do disparities in school discipline exist in our school or district?” The guide provides a set of tasks to help determine your data needs, harvest the data you already have at your disposal, identify additional data you may need, disaggregate and analyze your data, and then develop preliminary findings.
Stage 2: Getting at the Roots of Disparities addresses the question “What are the root causes of our disparities in school discipline?” You will learn how to dig deeper and conduct a root cause analysis to understand why disparities exist in your discipline outcomes.
Stage 3: Creating an Action Plan addresses the question “How will root causes of disparities in school discipline be addressed?” This stage walks you through developing an action plan for eliminating the disparities discovered in your root cause analysis that can be implemented, monitored, and continuously improved over time.
The guide includes a Disciplinary Disparities Risk Assessment Tool to aid in data gathering and analysis. The tool contains a series of Microsoft Excel–based worksheets, with detailed instructions on the kind of data to gather and how to analyze your results using a set of key questions. The tool automatically generates visual data displays to enhance analysis. This tool can be used as-is, modified, or serve as a model for designing a tool that can integrate with or import data from an existing school or district database or student management system. The tool also can be used in concert with existing data collection efforts, such as those connected with positive behavioral interventions and supports (PBIS).
The guide also includes the following: • Templates to help plan and facilitate communication among stakeholders; • Real-world examples from schools and districts already experiencing success; • Sidebars and tip sheets to extend knowledge; • Links to useful resources; • Strategies for doing a thorough job without getting bogged down; and • Tips for undertaking tough conversations.
Students engage in hands-on, true-to-life research experiences on air quality topics chosen …
Students engage in hands-on, true-to-life research experiences on air quality topics chosen for personal interest through a unit composed of one lesson and five associated activities. Using a project-based learning approach suitable for secondary science classrooms and low-cost air quality monitors, students gain the background and skills needed to conduct their own air quality research projects. The curriculum provides: 1) an introduction to air quality science, 2) data collection practice, 3) data analysis practice, 4) help planning and conducting a research project and 5) guidance in interpreting data and presenting research in professional poster format. The comprehensive curriculum requires no pre-requisite knowledge of air quality science or engineering. This curriculum takes advantage of low-cost, next-generation, open-source air quality monitors called Pods. These monitors were developed in a mechanical engineering lab at the University of Colorado Boulder and are used for academic research as well as education and outreach. The monitors are made available for use with this curriculum through AQ-IQ Kits that may be rented from the university by teachers. Alternatively, nearly the entire unit, including the student-directed projects, could also be completed without an air quality monitor. For example, students can design research projects that utilize existing air quality data instead of collecting their own, which is highly feasible since much data is publically available. In addition, other low-cost monitors could be used instead of the Pods. Also, the curriculum is intentionally flexible, so that the lesson and its activities can be used individually. See the Other section for details about the Pods and ideas for alternative equipment, usage without air quality monitors, and adjustments to individually teach the lesson and activities.
This lesson focuses on the observation of properties and the classification of …
This lesson focuses on the observation of properties and the classification of objects to build ideas about variables. Learners compare buttons to identify similarities and differences. In addition, learners are introduced to Venn Diagrams by reading "The Elves and the Shoemaker" and sorting their shoes in a giant diagram.
In this data analysis activity students investigate data in connection with recyclable …
In this data analysis activity students investigate data in connection with recyclable materials and develop plans to help the environment. Students collect data about aluminum can usage and graph that data in a line plot. The lesson includes student worksheet and extension suggestions.
In this 5-lesson unit primary students identify attributes of buttons and other …
In this 5-lesson unit primary students identify attributes of buttons and other objects in their classrooms. Throughout the unit students learn to collect data about objects, display the data (Venn diagrams, pictographs, and bar graphs), and analyze the data to determine what this tells us about buttons and/or other objects. Each of the five lesson plans includes necessary student/class worksheets, questions for students, extension ideas, and assessment ideas. Lessons 2 and 3 reference stories that are an important part of the skill development: "The Button Box" by Margarette Reid and "The Elves and the Shoemaker" story.
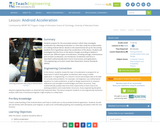
Students prepare for the associated activity in which they investigate acceleration by …
Students prepare for the associated activity in which they investigate acceleration by collecting acceleration vs. time data using the accelerometer of a sliding Android device. Based on the experimental set-up for the activity, students form hypotheses about the acceleration of the device. Students will investigate how the force on the device changes according to Newton's Second Law. Different types of acceleration, including average, instantaneous and constant acceleration, are introduced. Acceleration and force is described mathematically and in terms of processes and applications.
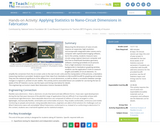
Measuring the dimensions of nano-circuits requires an expensive, high-resolution microscope with integrated …
Measuring the dimensions of nano-circuits requires an expensive, high-resolution microscope with integrated video camera and a computer with sophisticated imaging software, but in this activity, students measure nano-circuits using a typical classroom computer and (the free-to-download) GeoGebra geometry software. Inserting (provided) circuit pictures from a high-resolution microscope as backgrounds in GeoGebra's graphing window, students use the application's tools to measure lengths and widths of circuit elements. To simplify the conversion from the on-screen units to the real circuits' units and the manipulation of the pictures, a GeoGebra measuring interface is provided. Students export their data from GeoGebra to Microsoft® Excel® for graphing and analysis. They test the statistical significance of the difference in circuit dimensions, as well as obtain a correlation between average changes in original vs. printed circuits' widths. This activity and its associated lesson are suitable for use during the last six weeks of the AP Statistics course; see the topics and timing note below for details.
This two-lesson unit from Illuminations, exposes students to algebra, measurement, and data …
This two-lesson unit from Illuminations, exposes students to algebra, measurement, and data analysis concepts and the major theme of analyzing change. In the first lesson, students measure the heights of classmates and older students and construct a table of height and age data to compare them. The second lesson's instructional goal is to understand how change in one variable, age, can relate to change in a second variable, height. Instructional plan, questions for the students, assessment options, extensions, and teacher reflections are given.
In this lesson plan students conduct a survey of ten students, collect …
In this lesson plan students conduct a survey of ten students, collect data in a tally chart, and then display and analyze the results in a bar graph. In the analysis students must compare numbers, add, and subtract using the data in the bar graph to generate questions as well as answer them. The lesson plan includes a graph template, a link to an interactive graphing tool, extension questions, and a fact family sheet to show the related facts from their graph analysis.
The consideration of cord length is very important in a bungee jumpŰÓtoo …
The consideration of cord length is very important in a bungee jumpŰÓtoo short, and the jumper doesn't get much of a thrill; too long, and ouch! In this lesson, students model a bungee jump using a Barbieĺ¨ doll and rubber bands. The distance to which the doll will fall is directly proportional to the number of rubber bands, so this context is used to examine linear functions.
In this math activity, learners are challenged to create aluminum foil boats …
In this math activity, learners are challenged to create aluminum foil boats that will hold plastic bears until the boats sink. The lesson serves as a fun, hands-on way to collect data. Data from two attempts is collected and used to make two class box-and-whisker plots with some surprising results. This lesson guide includes questions for learners, assessment options, extensions, and reflection questions.
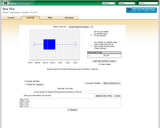
This Flash tool allows students to make a box plot of their …
This Flash tool allows students to make a box plot of their data, using up to four categories of their own choosing, or using one of the data sets provided. The tool will plot all the data together, or break it out by category. Students can set a multiple of the Interquartile Range to be the Extreme Range, and exclude that data from the graph if they wish. Associated lessons (free) and a Mathematics Assessment Sampler (for purchase) are linked at the right side of the page.
Soft Skills course FREE teacher resources and trial access to online course solution …
Soft Skills course FREE teacher resources and trial access to online course solution as well as a correlation to WI state standards (WCCTS). Resources available for:-Professionalism-Teamwork & Team Building-Problem Solving & Decision Making-Verbal Communication-Oral Communication
Using the story "The Celebrated Jumping Frog of Calaveras County" by Mark …
Using the story "The Celebrated Jumping Frog of Calaveras County" by Mark Twain, learners simulate a jumping-frog contest and determine the distances "jumped." Learners record the distance of individual jumps in centimeters and determine the total distance jumped (the sum of the three separate jumps) and the official distance (the straight-line distance from the starting line to the end of the frog's third jump). Learners compare the range and median of the total distances with those of the official distances of the group.
Students will simulate a jumping frog contest and collect data for frog …
Students will simulate a jumping frog contest and collect data for frog distances jumped. Students will measure three consecutive jumps along with the total distance jumped in centimeters. Students will determine the range of classroom data jumps and find the mean and the median of jump data.
This activity provides students with the opportunity to gather data from a …
This activity provides students with the opportunity to gather data from a controlled experiment setting, interpret their findings and use the data to draw conclusions to solve a mystery.
A pdf file that contains slides with visuals to be shown. It …
A pdf file that contains slides with visuals to be shown. It explains the CBC from its beginning to end with an example of Data taken from our local bird count.
Students will be instructed to build a data table and graph representing data. Then draw conclusions.
No restrictions on your remixing, redistributing, or making derivative works. Give credit to the author, as required.
Your remixing, redistributing, or making derivatives works comes with some restrictions, including how it is shared.
Your redistributing comes with some restrictions. Do not remix or make derivative works.
Most restrictive license type. Prohibits most uses, sharing, and any changes.
Copyrighted materials, available under Fair Use and the TEACH Act for US-based educators, or other custom arrangements. Go to the resource provider to see their individual restrictions.