In this module, students reconnect with and deepen their understanding of statistics …
In this module, students reconnect with and deepen their understanding of statistics and probability concepts first introduced in Grades 6, 7, and 8. Students develop a set of tools for understanding and interpreting variability in data, and begin to make more informed decisions from data. They work with data distributions of various shapes, centers, and spreads. Students build on their experience with bivariate quantitative data from Grade 8. This module sets the stage for more extensive work with sampling and inference in later grades.
Find the rest of the EngageNY Mathematics resources at https://archive.org/details/engageny-mathematics.
Students learn a simple technique for quantifying the amount of photosynthesis that …
Students learn a simple technique for quantifying the amount of photosynthesis that occurs in a given period of time, using a common water plant (Elodea). They can use this technique to compare the amounts of photosynthesis that occur under conditions of low and high light levels. Before they begin the experiment, however, students must come up with a well-worded hypothesis to be tested. After running the experiment, students pool their data to get a large sample size, determine the measures of central tendency of the class data, and then graph and interpret the results.
Students use U.S. Geological Survey (USGS) real-time, real-world seismic data from around …
Students use U.S. Geological Survey (USGS) real-time, real-world seismic data from around the planet to identify where earthquakes occur and look for trends in earthquake activity. They explore where and why earthquakes occur, learning about faults and how they influence earthquakes. Looking at the interactive maps and the data, students use Microsoft® Excel® to conduct detailed analysis of the most-recent 25 earthquakes; they calculate mean, median, mode of the data set, as well as identify the minimum and maximum magnitudes. Students compare their predictions with the physical data, and look for trends to and patterns in the data. A worksheet serves as a student guide for the activity.
In this math activity, learners prepare jumping jack data to send to …
In this math activity, learners prepare jumping jack data to send to officials on the planet Jumpalot. Learners record how many jumping jacks they can do in ten seconds and use their knowledge of time conversions to figure out how many jumping jacks they could complete in a minute all the way to a year. Learners then organize group data and explore mean, median, and mode and the effects extreme values have on these measures. Finally, learners brainstorm the advantages and disadvantages each measure offers. This lesson guide includes questions for learners, assessment options, extensions, and reflection questions.
In this math meets engineering activity, learners make paper airplanes and explore …
In this math meets engineering activity, learners make paper airplanes and explore attributes related to increasing flight distances. Each learner collects data from three flights of the airplane and finds the median distance. Learners then collect, organize, display, and interpret the median distances for the group in a stem-and-leaf plot. This lesson guide includes questions for learners, assessment options, extensions, and reflection questions.
This applet allows the user to investigate the mean, median, and box-and-whisker …
This applet allows the user to investigate the mean, median, and box-and-whisker plot for a set of data that they create. The data set may contain up to 15 integers, each with a value from 0 to 100.
Students experience data collection, analysis and inquiry in this LEGO® MINDSTORMS® NXT …
Students experience data collection, analysis and inquiry in this LEGO® MINDSTORMS® NXT -based activity. They measure the position of an oscillating platform using a ultrasonic sensor and perform statistical analysis to determine the mean, mode, median, percent difference and percent error for the collected data.
Focuses on Hindustani classical music of North India, and also involves learning …
Focuses on Hindustani classical music of North India, and also involves learning about the ancient foundations of the rich classical traditions of music and dance of all Indian art and culture. Practice of the ragas and talas through the learning of songs, dance, and drumming compositions. Develops insights through listening, readings, and concert attendance.
PlopIt allows users to build dot plots of data using the mouse. …
PlopIt allows users to build dot plots of data using the mouse. View how the mean, median, and mode change as entries are added to the plot. Parameters: Range for observations.
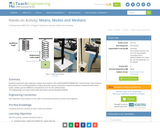
This Lesson Plan goes over how to find the Mean, Median, Mode, …
This Lesson Plan goes over how to find the Mean, Median, Mode, IQR, and Mean Absolute Deviation of a data set. We will go over some generic examples in the lesson and then do some practical application, as we find each of these from the samples taken to ensure consistent weight of the paper from BPM.
This activity displays a stem and leaf plot representing data either entered …
This activity displays a stem and leaf plot representing data either entered by the user or generated by the computer. The user can use the applet as a tool that creates a stem and leaf plot from data the user inputs, or to practice calculating the mean, median, and mode of a given data set.
(Nota: Esta es una traducción de un recurso educativo abierto creado por …
(Nota: Esta es una traducción de un recurso educativo abierto creado por el Departamento de Educación del Estado de Nueva York (NYSED) como parte del proyecto "EngageNY" en 2013. Aunque el recurso real fue traducido por personas, la siguiente descripción se tradujo del inglés original usando Google Translate para ayudar a los usuarios potenciales a decidir si se adapta a sus necesidades y puede contener errores gramaticales o lingüísticos. La descripción original en inglés también se proporciona a continuación.)
En este módulo, los estudiantes reconectan y profundizan su comprensión de las estadísticas y los conceptos de probabilidad introducidos por primera vez en los grados 6, 7 y 8. Los estudiantes desarrollan un conjunto de herramientas para comprender e interpretar la variabilidad en los datos, y comienzan a tomar decisiones más informadas de los datos . Trabajan con distribuciones de datos de varias formas, centros y diferenciales. Los estudiantes se basan en su experiencia con datos cuantitativos bivariados del grado 8. Este módulo prepara el escenario para un trabajo más extenso con muestreo e inferencia en calificaciones posteriores.
Encuentre el resto de los recursos matemáticos de Engageny en https://archive.org/details/engageny-mathematics.
English Description: In this module, students reconnect with and deepen their understanding of statistics and probability concepts first introduced in Grades 6, 7, and 8. Students develop a set of tools for understanding and interpreting variability in data, and begin to make more informed decisions from data. They work with data distributions of various shapes, centers, and spreads. Students build on their experience with bivariate quantitative data from Grade 8. This module sets the stage for more extensive work with sampling and inference in later grades.
Find the rest of the EngageNY Mathematics resources at https://archive.org/details/engageny-mathematics.
No restrictions on your remixing, redistributing, or making derivative works. Give credit to the author, as required.
Your remixing, redistributing, or making derivatives works comes with some restrictions, including how it is shared.
Your redistributing comes with some restrictions. Do not remix or make derivative works.
Most restrictive license type. Prohibits most uses, sharing, and any changes.
Copyrighted materials, available under Fair Use and the TEACH Act for US-based educators, or other custom arrangements. Go to the resource provider to see their individual restrictions.