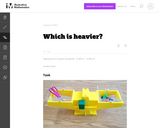
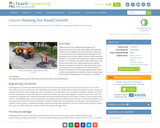
In this activity using a balance scale students practice weighing items to …
In this activity using a balance scale students practice weighing items to see how heavy they are. Cubes are used in the balance as units of measure so students may easily count them.
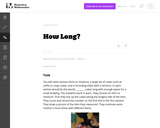
Students work in pairs to measure length by lining up cubes along …
Students work in pairs to measure length by lining up cubes along the longest side of an item. They count and record length by counting the number of cubes.
Kindergartners measure each other's height using large building blocks, then visit a …
Kindergartners measure each other's height using large building blocks, then visit a 2nd and a 4th grade class to measure those students. They can also measure adults in the school community. Results are displayed in age-appropriate bar graphs (paper cut-outs of miniature building blocks glued on paper to form a bar graph) comparing the different age groups. The activities that comprise this lesson help students develop the concepts and vocabulary to describe, in a non-ambiguous way, how height changes as children get older. The introduction to graphing provides an important foundation for both creating and interpreting graphs in future years.
This link has a teacher guide, 3 student graphing activity sheets, rubric …
This link has a teacher guide, 3 student graphing activity sheets, rubric and a complete description of the activities related to climate change and invasive species.
Students learn how roadways are designed and constructed, and discuss the advantages …
Students learn how roadways are designed and constructed, and discuss the advantages and limitations of the current roadway construction process. They look at current practices of roadway monitoring, discuss the limitations, and consider ways to further road monitoring research. To conclude, student groups compete to design smooth, cost-efficient and sound model road bases using gravel, sand, water and rubber (representing asphalt). This lesson prepares students for the associated activity in which they act as civil engineers hired by USDOT to research through their own model experimentation how to best use piezoelectric materials to detect road damage by showing how piezoelectric transducers can indicate road damage.
How many Krispy Kreme donuts are in this giant box? Through the …
How many Krispy Kreme donuts are in this giant box? Through the use of photographs, an email from the Krispy Kreme company, and a news report, students are challenged to use estimation and measurement to determine exactly how many Krispy Kreme donuts fit into the extra large box.
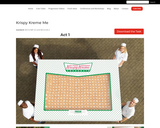
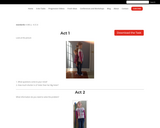
How much shorter is Lil' Sister than Big Sister? This 3 Act …
How much shorter is Lil' Sister than Big Sister? This 3 Act Task by Graham Fletcher begins with picture of two sisters standing back to back. First students make observations and estimates to begin determine how much shorter the little sister is to the bigger sister. Students can then use images of each sister along with a measuring tool of interlocking cubes to determine the height of each sister. Lastly, students will find the difference between the girls' two heights. Students are estimating, measuring, adding, and subtracting to determine how much shorter the little sister is than the big sister.
In this task students figure out how to draw the longest line …
In this task students figure out how to draw the longest line on a map of the United States without hitting a border. They use color and line plots to keep track of their results.
You are a material scientist who just crash-landed on an abandoned mining …
You are a material scientist who just crash-landed on an abandoned mining planet. You’re out of fuel, and your suit’s oxygen is running low. You need to mine enough fuel to power your ship, or you won’t survive.
You stumble into the old mining facility. That’s where you meet MAL, the mine’s Artificial Intelligence, who is thrilled to have someone to talk to. With MAL’s help, you’ll build scientific models to predict if you’re mining fast enough and what you need to do next.
Each level puts the student in the role of the scientific modeler. Students will set up equations, work with graphs, input data, and use models to make predictions. Along the way, as obstacles keep popping up, students will experience how models are used as a tool to make decisions.
Note: For best compatibility, use Chrome.
Use Lost at the Forever Mine to introduce units on graphing or scientific modeling. The game was designed to help kids experience the need for math to make predictions. This story-based game gives a context to why graphing, math equations, and collecting data can help us solve problems.
Try introducing a unit with this game. Let the kids figure out how the game works with little introduction. Remember, struggling to figure it out is part of the process. Games are safe places for struggle and failure to become part of the fun.
The purpose of this task is for students to compare two options …
The purpose of this task is for students to compare two options for a prize where the value of one is given $2 at a time, giving them an opportunity to "work with equal groups of objects to gain foundations for multiplication." This context also provides students with an introduction to the concept of delayed gratification, or resisting an immediate reward and waiting for a later reward, while working with money.
This resource First Grade Math Talks and was inspired by learning within …
This resource First Grade Math Talks and was inspired by learning within The Power of Early Mathematics, 2024, a WISELearn Innovation Grant funded WI Department of Public Instruction learning series. powerofearlymath
This collection of five lessons explores 3rd grade mathematical concepts in the …
This collection of five lessons explores 3rd grade mathematical concepts in the context of the outdoor classroom. These lessons span various math and science curricular units and include:Arrays in Nature (modeling multiplication)Measurement in Nature (length/mass and traits of organisms)Fraction Snow Cakes (fractions)Engineering and Design - Flight (measurement/data and forces)BioBlitzes (measurement/data, diversity and traits)
The purpose of the task is for students to solve a multi-step …
The purpose of the task is for students to solve a multi-step multiplication problem in a context that involves area. In addition, the numbers were chosen to determine if students have a common misconception related to multiplication.
In this task students work with partners to measure themselves by laying …
In this task students work with partners to measure themselves by laying multiple copies of a shorter object that represents the length unit end to end. It gives students the opportunity to discuss the need to be careful when measuring.
Students learn the metric units engineers use to measure mass, distance (or …
Students learn the metric units engineers use to measure mass, distance (or length) and volume. They make estimations using these units and compare their guesses with actual values. To introduce the concepts, the teacher needs access to a meter stick, a one-liter bottle, a glass container that measures milliliters and a gram scale.
Students learn about the statistical analysis of measurements and error propagation, reviewing …
Students learn about the statistical analysis of measurements and error propagation, reviewing concepts of precision, accuracy and error types. This is done through calculations related to the concept of density. Students work in teams to each measure the dimensions and mass of five identical cubes, compile the measurements into small data sets, calculate statistics including the mean and standard deviation of these measurements, and use the mean values of the measurements to calculate density of the cubes. Then they use this calculated density to determine the mass of a new object made of the same material. This is done by measuring the appropriate dimensions of the new object, calculating its volume, and then calculating its mass using the density value. Next, the mass of the new object is measured by each student group and the standard deviation of the measurements is calculated. Finally, students determine the accuracy of the calculated mass by comparing it to the measured mass, determining whether the difference in the measurements is more or less than the standard deviation.
No restrictions on your remixing, redistributing, or making derivative works. Give credit to the author, as required.
Your remixing, redistributing, or making derivatives works comes with some restrictions, including how it is shared.
Your redistributing comes with some restrictions. Do not remix or make derivative works.
Most restrictive license type. Prohibits most uses, sharing, and any changes.
Copyrighted materials, available under Fair Use and the TEACH Act for US-based educators, or other custom arrangements. Go to the resource provider to see their individual restrictions.