This is a task from the Illustrative Mathematics website that is one ...
This is a task from the Illustrative Mathematics website that is one part of a complete illustration of the standard to which it is aligned. Each task has at least one solution and some commentary that addresses important aspects of the task and its potential use.
This course is oriented toward US high school students. The course is ...
This course is oriented toward US high school students. The course is divided into 10 units of study. The first five units build the foundation of concepts, vocabulary, knowledge, and skills for success in the remainder of the course. In the final five units, we will take the plunge into the domain of inferential statistics, where we make statistical decisions based on the data that we have collected.
In this module, students reconnect with and deepen their understanding of statistics ...
In this module, students reconnect with and deepen their understanding of statistics and probability concepts first introduced in Grades 6, 7, and 8. Students develop a set of tools for understanding and interpreting variability in data, and begin to make more informed decisions from data. They work with data distributions of various shapes, centers, and spreads. Students build on their experience with bivariate quantitative data from Grade 8. This module sets the stage for more extensive work with sampling and inference in later grades.
This is a "first course" in the sense that it presumes no ...
This is a "first course" in the sense that it presumes no previous course in probability. The units are modules taken from the unpublished text: Paul E. Pfeiffer, ELEMENTS OF APPLIED PROBABILITY, USING MATLAB. The units are numbered as they appear in the text, although of course they may be used in any desired order. For those who wish to use the order of the text, an outline is provided, with indication of which modules contain the material.
Focuses on modeling, quantification, and analysis of uncertainty by teaching random variables, ...
Focuses on modeling, quantification, and analysis of uncertainty by teaching random variables, simple random processes and their probability distributions, Markov processes, limit theorems, elements of statistical inference, and decision making under uncertainty. This course extends the discrete probability learned in the discrete math class. It focuses on actual applications, and places little emphasis on proofs. A problem set based on identifying tumors using MRI (Magnetic Resonance Imaging) is done using Matlab.
I designed the course for graduate students who use statistics in their ...
I designed the course for graduate students who use statistics in their research, plan to use statistics, or need to interpret statistical analyses performed by others. The primary audience are graduate students in the environmental sciences, but the course should benefit just about anyone who is in graduate school in the natural sciences. The course is not designed for those who want a simple overview of statistics; well learn by analyzing real data. This course or equivalent is required for UMB Biology and EEOS Ph.D. students. It is a recommended course for several of the intercampus graduate school of marine science program options.
Measuring the dimensions of nano-circuits requires an expensive, high-resolution microscope with integrated ...
Measuring the dimensions of nano-circuits requires an expensive, high-resolution microscope with integrated video camera and a computer with sophisticated imaging software, but in this activity, students measure nano-circuits using a typical classroom computer and (the free-to-download) GeoGebra geometry software. Inserting (provided) circuit pictures from a high-resolution microscope as backgrounds in GeoGebra's graphing window, students use the application's tools to measure lengths and widths of circuit elements. To simplify the conversion from the on-screen units to the real circuits' units and the manipulation of the pictures, a GeoGebra measuring interface is provided. Students export their data from GeoGebra to Microsoft® Excel® for graphing and analysis. They test the statistical significance of the difference in circuit dimensions, as well as obtain a correlation between average changes in original vs. printed circuits' widths. This activity and its associated lesson are suitable for use during the last six weeks of the AP Statistics course; see the topics and timing note below for details.
The Art of the Probable" addresses the history of scientific ideas, in ...
The Art of the Probable" addresses the history of scientific ideas, in particular the emergence and development of mathematical probability. But it is neither meant to be a history of the exact sciences per se nor an annex to, say, the Course 6 curriculum in probability and statistics. Rather, our objective is to focus on the formal, thematic, and rhetorical features that imaginative literature shares with texts in the history of probability. These shared issues include (but are not limited to): the attempt to quantify or otherwise explain the presence of chance, risk, and contingency in everyday life; the deduction of causes for phenomena that are knowable only in their effects; and, above all, the question of what it means to think and act rationally in an uncertain world. Our course therefore aims to broaden students’ appreciation for and understanding of how literature interacts with--both reflecting upon and contributing to--the scientific understanding of the world. We are just as centrally committed to encouraging students to regard imaginative literature as a unique contribution to knowledge in its own right, and to see literary works of art as objects that demand and richly repay close critical analysis. It is our hope that the course will serve students well if they elect to pursue further work in Literature or other discipline in SHASS, and also enrich or complement their understanding of probability and statistics in other scientific and engineering subjects they elect to take.
This course covers sensing and measurement for quantitative molecular/cell/tissue analysis, in terms ...
This course covers sensing and measurement for quantitative molecular/cell/tissue analysis, in terms of genetic, biochemical, and biophysical properties. Methods include light and fluorescence microscopies; electro-mechanical probes such as atomic force microscopy, laser and magnetic traps, and MEMS devices; and the application of statistics, probability and noise analysis to experimental data.
This task asks students to glean contextual information about bird eggs from ...
This task asks students to glean contextual information about bird eggs from a collection of measurements of said eggs organized in a scatter plot. In particular, students are asked to identify a correlation and use it to make interpolative predictions, and reason about the properties of specific eggs via the graphical presentation of the data.
Introductory survey of quantitative methods (QM), or the application of statistics in ...
Introductory survey of quantitative methods (QM), or the application of statistics in the workplace. Examines techniques for gathering, analyzing, and interpreting data in any number of fieldsĺÎĺ from anthropology to hedge fund management.
Statistics is the study of variability. Students who understand statistics need to ...
Statistics is the study of variability. Students who understand statistics need to be able to identify and pose questions that can be answered by data that vary. The purpose of this task is to provide questions related to a particular context (a jar of buttons) so that students can identify which are statistical questions. The task also provides students with an opportunity to write a statistical question that pertains to the context.
This task was developed by high school and postsecondary mathematics and design/pre-construction ...
This task was developed by high school and postsecondary mathematics and design/pre-construction educators, and validated by content experts in the Common Core State Standards in mathematics and the National Career Clusters Knowledge & Skills Statements. It was developed with the purpose of demonstrating how the Common Core and CTE Knowledge & Skills Statements can be integrated into classroom learning - and to provide classroom teachers with a truly authentic task for either mathematics or CTE courses.
Collaborative Statistics was written by Barbara Illowsky and Susan Dean, faculty members ...
Collaborative Statistics was written by Barbara Illowsky and Susan Dean, faculty members at De Anza College in Cupertino, California. The textbook was developed over several years and has been used in regular and honors-level classroom settings and in distance learning classes. This textbook is intended for introductory statistics courses being taken by students at two– and four–year colleges who are majoring in fields other than math or engineering. Intermediate algebra is the only prerequisite. The book focuses on applications of statistical knowledge rather than the theory behind it.
Collaborative Statistics was written by Barbara Illowsky and Susan Dean, faculty members ...
Collaborative Statistics was written by Barbara Illowsky and Susan Dean, faculty members at De Anza College in Cupertino, California. The textbook was developed over several years and has been used in regular and honors-level classroom settings and in distance learning classes. This textbook is intended for introductory statistics courses being taken by students at two– and four–year colleges who are majoring in fields other than math or engineering. Intermediate algebra is the only prerequisite. The book focuses on applications of statistical knowledge rather than the theory behind it. This custom textbook collection has been modified by R. Bloom for her classes at De Anza College; the homework content for the custom collection is now contained in a separate homework collection.
This is a custom collection (by R. Bloom) of homework and review ...
This is a custom collection (by R. Bloom) of homework and review problems to accompany Collaborative Statistics textbook custom collection by R. Bloom. Content is derived from Collaborative Statistics written by Barbara Illowsky and Susan Dean, faculty members at De Anza College in Cupertino, California. The textbook by S. Dean and B. Illowsky was developed over several years and has been used in regular and honors-level classroom settings and in distance learning classes. This textbook is intended for introductory statistics courses being taken by students at two– and four–year colleges who are majoring in fields other than math or engineering. Intermediate algebra is the only prerequisite. The book focuses on applications of statistical knowledge rather than the theory behind it. This custom version of their collection has been modified by R. Bloom for her classes at De Anza College.
n this task, students are able to conjecture about the differences in ...
n this task, students are able to conjecture about the differences in the two groups from a strictly visual perspective and then support their comparisons with appropriate measures of center and variability. This will reinforce that much can be gleaned simply from visual comparison of appropraite graphs, particularly those of similar scale. Students are also encouraged to consider how certain measurements and observation values from one group compare in the context of the other group.
Introduces students to the basic tools in using data to make informed ...
Introduces students to the basic tools in using data to make informed management decisions. Covers introductory probability, decision analysis, basic statistics, regression, simulation, and linear and nonlinear optimization. Computer spreadsheet exercises and examples drawn from marketing, finance, operations management, and other management functions. Restricted to Sloan Fellows.
Students groups create scientific research posters to professionally present the results of ...
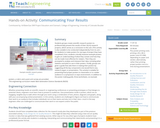
Students groups create scientific research posters to professionally present the results of their AQ-IQ research projects, which serves as a conclusion to the unit. (This activity is also suitable to be conducted independently from its unit—for students to make posters for any type of project they have completed.) First, students critically examine example posters to gain an understanding of what they contain and how they can be made most effective for viewers. Then they are prompted to analyze and interpret their data, including what statistics and plots to use in their posters. Finally, groups are given a guide that aids them in making their posters by suggesting all the key components one would find in any research paper or presentation. This activity is suitable for presenting final project posters to classmates or to a wider audience in a symposium or expo environment. In addition to the poster-making guide, three worksheets, six example posters, a rubric and a post-unit survey are provided.
This course covers the analytical, graphical, and numerical methods supporting the analysis ...
This course covers the analytical, graphical, and numerical methods supporting the analysis and design of integrated biological systems. Topics include modularity and abstraction in biological systems, mathematical encoding of detailed physical problems, numerical methods for solving the dynamics of continuous and discrete chemical systems, statistics and probability in dynamic systems, applied local and global optimization, simple feedback and control analysis, statistics and probability in pattern recognition.
Students learn about the role engineers and mathematicians play in developing the ...
Students learn about the role engineers and mathematicians play in developing the perfect bungee cord length by simulating and experimenting with bungee jumping using washers and rubber bands. Working as if they are engineers for a (hypothetical) amusement park, students are challenged to develop a show-stopping bungee jumping ride that is safe. To do this, they must find the maximum length of the bungee cord that permits jumpers (such as brave Washy!) to get as close to the ground as possible without going "splat"! This requires them to learn about force and displacement and run an experiment. Student teams collect and plot displacement data and calculate the slope, linear equation of the line of best fit and spring constant using Hooke's law. Students make hypotheses, interpret scatter plots looking for correlations, and consider possible sources of error. An activity worksheet, pre/post quizzes and a PowerPoint® presentation are included.
This is a task from the Illustrative Mathematics website that is one ...
This is a task from the Illustrative Mathematics website that is one part of a complete illustration of the standard to which it is aligned. Each task has at least one solution and some commentary that addresses important aspects of the task and its potential use.
This course covers the design, construction, and testing of field robotic systems, ...
This course covers the design, construction, and testing of field robotic systems, through team projects with each student responsible for a specific subsystem. Projects focus on electronics, instrumentation, and machine elements. Design for operation in uncertain conditions is a focus point, with ocean waves and marine structures as a central theme. Topics include basic statistics, linear systems, Fourier transforms, random processes, spectra, ethics in engineering practice, and extreme events with applications in design.
This task introduces the fundamental statistical ideas of using data summaries (statistics) ...
This task introduces the fundamental statistical ideas of using data summaries (statistics) from random samples to draw inferences (reasoned conclusions) about population characteristics (parameters). In the task built around an election poll scenario, the population is the entire seventh grade class, the unknown characteristic (parameter) of interest is the proportion of the class members voting for a specific candidate, and the sample summary (statistic) is the observed proportion of voters favoring the candidate in a random sample of class members.
n addition to providing a task that relates to other disciplines (history, ...
n addition to providing a task that relates to other disciplines (history, civics, current events, etc.), this task is intended to demonstrate that a graph can summarize a distribution as well as provide useful information about specific observations.
The task is designed to show that random samples produce distributions of ...
The task is designed to show that random samples produce distributions of sample means that center at the population mean, and that the variation in the sample means will decrease noticeably as the sample size increases. Random sampling (like mixing names in a hat and drawing out a sample) is not a new idea to most students, although the terminology is likely to be new.
This lesson unit addresses common misconceptions relating to probability of simple and ...
This lesson unit addresses common misconceptions relating to probability of simple and compound events. The lesson will help you assess how well students understand concepts of: Equally likely events; randomness; and sample sizes.
In this module, students move from simply representing data into analysis of ...
In this module, students move from simply representing data into analysis of data. Students begin to think and reason statistically, first by recognizing a statistical question as one that can be answered by collecting data. Students learn that the data collected to answer a statistical question has a distribution that is often summarized in terms of center, variability, and shape. Throughout the module, students see and represent data distributions using dot plots and histograms. They study quantitative ways to summarize numerical data sets in relation to their context and to the shape of the distribution. As the module ends, students synthesize what they have learned as they connect the graphical, verbal, and numerical summaries to each other within situational contexts, culminating with a major project.
No restrictions on your remixing, redistributing, or making derivative works. Give credit to the author, as required.
Your remixing, redistributing, or making derivatives works comes with some restrictions, including how it is shared.
Your redistributing comes with some restrictions. Do not remix or make derivative works.
Most restrictive license type. Prohibits most uses, sharing, and any changes.
Copyrighted materials, available under Fair Use and the TEACH Act for US-based educators, or other custom arrangements. Go to the resource provider to see their individual restrictions.