This unit consists of four lessons in which students explore several meanings …
This unit consists of four lessons in which students explore several meanings and representations of multiplication, including number lines, sets, arrays, and balance beams. They also learn about the commutative property of multiplication, the results of multiplying by 1 and by 0, and the inverse property of multiplication. Students write story problems and create pictographs. The unit includes activity sheets, assessment ideas, links to related applets, reflective questions for students and teachers, extensions and a bibliography of children's literature with a multiplication focus.
This unit contains two lessons which help students develop number sense through …
This unit contains two lessons which help students develop number sense through activities involving collection, representation, and analysis of data. Students also practice reading and writing large numbers and develop estimation skills. In Lesson 1, Every Breath You Take, students estimate the number of breaths taken during a specified time, experiment, and display real-life data. In Lesson 2, Making Your First Millions, students develop the concept of a million by working with smaller numerical units, such as blocks of 10 or 100, and then expanding the idea by multiplication or repeated addition. They analyze situations and identify patterns that will enable them to develop the concept of large numbers. Each lesson includes student activity sheets, an instructional plan, and extensions.
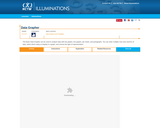
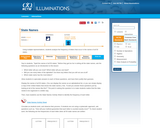
Students use this interactive tool to explore the connections between data sets …
Students use this interactive tool to explore the connections between data sets and their representations in charts and graphs. Enter data in a table (1 to 6 columns, unlimited rows), and preview or print bar graphs, line graphs, pie charts, and pictographs. Students can select which set(s) of data to display in each graph, and compare the effects of different representations of the same data. Instructions and exploration questions are provided using the expandable "+" signs above the tool.
In this 7- lesson unit students use tallies, pictographs, bar graphs, line …
In this 7- lesson unit students use tallies, pictographs, bar graphs, line plots, circle graphs, box-and-whisker plots, and glyphs to collect and display data about healthy eating. The unit includes lessons in which two sets of data are being compared and data sets are being analyzed for measures of central tendency (mean, median, mode). Learning objectives, materials, student questions, extensions, teacher reflections, and links to create graphs virtually are included.
This 10-day module builds on Grade 2 concepts about data, graphing, and …
This 10-day module builds on Grade 2 concepts about data, graphing, and line plots. The two topics in this module focus on generating and analyzing categorical and measurement data. By the end of the module, students are working with a mixture of scaled picture graphs, bar graphs, and line plots to problem solve using both categorical and measurement data.
Find the rest of the EngageNY Mathematics resources at https://archive.org/details/engageny-mathematics.
In this recycling activity students conduct a poll and display data showing …
In this recycling activity students conduct a poll and display data showing which type of material the survey population feels is the best for shopping bags. Students share their results in a data display of their choice and then use the data to draw conclusions and create a recycling plan. The activity includes the student worksheet, extension suggestions, and related resources.
This 2-lesson unit focuses on combinations, a subject related to probability. Students …
This 2-lesson unit focuses on combinations, a subject related to probability. Students develop strategies for discovering all the possible combinations in two given situations. They learn to collect and organize data and then use the results to generalize methods for determining possible combinations. They discuss how the number of possible outcomes is affected by decisions about the order of choices, or whether choices may be repeated. The unit includes student activity sheets, questions and extensions for students, and a link to an interactive applet.
This Check Your Readiness Assessment is used in conjunction with the Illustrative …
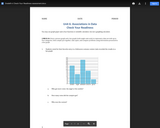
This Check Your Readiness Assessment is used in conjunction with the Illustrative Mathematics Curriculum. It breaks down identifying the Essential Standard associated. This assessment should be utilized with the uploaded rubric to determine levels of prerequisite skills when beginning a new unit and allow for placement of interventions.
This Check Your Readiness Rubric is used in conjunction with the Illustrative …
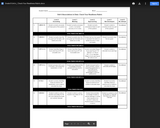
This Check Your Readiness Rubric is used in conjunction with the Illustrative Mathematics Curriculum. It breaks down each question by identifying the Essential Standard associated and then defining what an Advanced, Proficient, Basic or Below Basic student response would entail. This rubric can then be utilized to determine levels of prerequisite skills when beginning a new unit and allow for placement of interventions.
In this unit plan students apply their knowledge of data collection, display, …
In this unit plan students apply their knowledge of data collection, display, and analysis to create a plan for improving the environment. Each of the four lessons in this unit requires students to collect data about recyclable materials and display the data for analysis. Each lesson includes students worksheets (PDF), discussion questions, and extension ideas.
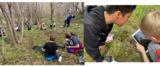
This collection of five lessons explores 3rd grade mathematical concepts in the …
This collection of five lessons explores 3rd grade mathematical concepts in the context of the outdoor classroom. These lessons span various math and science curricular units and include:Arrays in Nature (modeling multiplication)Measurement in Nature (length/mass and traits of organisms)Fraction Snow Cakes (fractions)Engineering and Design - Flight (measurement/data and forces)BioBlitzes (measurement/data, diversity and traits)
(Nota: Esta es una traducción de un recurso educativo abierto creado por …
(Nota: Esta es una traducción de un recurso educativo abierto creado por el Departamento de Educación del Estado de Nueva York (NYSED) como parte del proyecto "EngageNY" en 2013. Aunque el recurso real fue traducido por personas, la siguiente descripción se tradujo del inglés original usando Google Translate para ayudar a los usuarios potenciales a decidir si se adapta a sus necesidades y puede contener errores gramaticales o lingüísticos. La descripción original en inglés también se proporciona a continuación.)
Este módulo de 10 días se basa en conceptos de grado 2 sobre datos, gráficos y parcelas de línea. Los dos temas en este módulo se centran en generar y analizar datos categóricos y de medición. Al final del módulo, los estudiantes están trabajando con una mezcla de gráficos de imágenes escalados, gráficos de barras y gráficos de línea para resolver problemas utilizando datos categóricos y de medición.
Encuentre el resto de los recursos matemáticos de Engageny en https://archive.org/details/engageny-mathematics.
English Description: This 10-day module builds on Grade 2 concepts about data, graphing, and line plots. The two topics in this module focus on generating and analyzing categorical and measurement data. By the end of the module, students are working with a mixture of scaled picture graphs, bar graphs, and line plots to problem solve using both categorical and measurement data.
Find the rest of the EngageNY Mathematics resources at https://archive.org/details/engageny-mathematics.
In this Illuminations unit (three lessons), students formulate and refine questions that …
In this Illuminations unit (three lessons), students formulate and refine questions that can be addressed by categorical data (Lesson 1) and numerical data (Lesson 2). They then collect, organize, and display with bar and circle graphs relevant data to answer those questions. They recognize the differences in analyzing categorical and numerical data. In the final lesson students identify examples of each type of data by looking at the question asked and discover the type of data collected determines the type of data display that is the most appropriate way of representing it. Students work with partners to collect data and create graphs for both types of data using the Data Grapher (cataloged separately).
In this lesson plan students explore the four forces of flight in …
In this lesson plan students explore the four forces of flight in order to complete the "Rescue Mission". Students must use their knowledge of probability to choose the spinner that will help them win the game. Students must also use their knowledge of graphing points on a coordinate grid in order to plot the results of each spin. The game board and spinners are included (PDF).
In this lesson plan students use various types of visual representation to …
In this lesson plan students use various types of visual representation to compare data about the number of letters in the name of each state; students create bar graphs from which they find the Mean, Median, Mode, and Range of their data set (10 states only). These data landmarks and visual representations are used to compare their data with their classmates. The lesson plan includes a grid paper document for creating the bar graph and a link to an applet for a State Data Map (cataloged separately).
In this data analysis lesson students explore various representations, including bar graphs, …
In this data analysis lesson students explore various representations, including bar graphs, steam-and-leaf plots, and box-and-whisker plots, to analyze the frequency of letters in the names of the 50 states. Students are encouraged to use a systematic approach to collect their data and are shown various tools to help them gather and display it. The lesson includes a student worksheet (PDF), links to a Decrypting Text website, Bar Grapher tool, and Box Plotter tool, and suggested questions, extension, and assessment ideas.
In this statistics lesson plan, students gather information using the Internet about …
In this statistics lesson plan, students gather information using the Internet about party affiliation and age at time of inauguration of current and past Presidents in order to construct a bar graph and a histogram. Once all of the data is collected students work together to complete the appropriate data displays and compare and contrast their findings. The lesson plan includes questions for reflection and discussion, student activity sheet, answer key, and an assessment option activity sheet and answer key.
In this month-long interdisciplinary project students collect weather data, determine the best …
In this month-long interdisciplinary project students collect weather data, determine the best visual representation for displaying it, and discuss the patterns and implications of their findings. This resource includes extension and assessment suggestions and guiding questions.
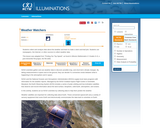
Weather and Climate Nature Journaling - This unit overview describes five field …
Weather and Climate Nature Journaling - This unit overview describes five field experience opportunities to engage students in studies of weather, forecasting and weather hazards. Each experience explains ways to incorporate science journaling, math, tech and literacy.
No restrictions on your remixing, redistributing, or making derivative works. Give credit to the author, as required.
Your remixing, redistributing, or making derivatives works comes with some restrictions, including how it is shared.
Your redistributing comes with some restrictions. Do not remix or make derivative works.
Most restrictive license type. Prohibits most uses, sharing, and any changes.
Copyrighted materials, available under Fair Use and the TEACH Act for US-based educators, or other custom arrangements. Go to the resource provider to see their individual restrictions.