This unit focuses on measurement and data for second grade. The second-graders …
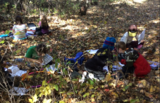
This unit focuses on measurement and data for second grade. The second-graders learn how toaccurately measure natural objects using nonstandard units (unifix cubes) and standard units(inches). During field experiences, the students learned how to use field guides and how to collectdata for a BioBlitz. Students used their data to create bar graphs, picture graphs and analyzed theirdata.
This lesson focuses on the observation of properties and the classification of …
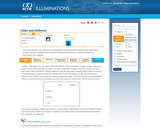
This lesson focuses on the observation of properties and the classification of objects to build ideas about variables. Learners compare buttons to identify similarities and differences. In addition, learners are introduced to Venn Diagrams by reading "The Elves and the Shoemaker" and sorting their shoes in a giant diagram.
In this 5-lesson unit primary students identify attributes of buttons and other …
In this 5-lesson unit primary students identify attributes of buttons and other objects in their classrooms. Throughout the unit students learn to collect data about objects, display the data (Venn diagrams, pictographs, and bar graphs), and analyze the data to determine what this tells us about buttons and/or other objects. Each of the five lesson plans includes necessary student/class worksheets, questions for students, extension ideas, and assessment ideas. Lessons 2 and 3 reference stories that are an important part of the skill development: "The Button Box" by Margarette Reid and "The Elves and the Shoemaker" story.
In this lesson students use a rule of thumb about the weight …
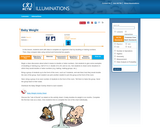
In this lesson students use a rule of thumb about the weight of babies to practice doubling and halving numbers. They complete an organized table and compare data using vertical and horizontal double bar graphs. The lesson includes a student activity sheet and extension ideas.
In this lesson plan students conduct a survey of ten students, collect …
In this lesson plan students conduct a survey of ten students, collect data in a tally chart, and then display and analyze the results in a bar graph. In the analysis students must compare numbers, add, and subtract using the data in the bar graph to generate questions as well as answer them. The lesson plan includes a graph template, a link to an interactive graphing tool, extension questions, and a fact family sheet to show the related facts from their graph analysis.
In this 8-lesson unit students use buttons to explore logical and numerical …
In this 8-lesson unit students use buttons to explore logical and numerical relationships that form the conceptual basis for understanding addition and subtraction operations. Topics include counting, ordinal numbers (and relative position), classification (attributes), relationships between numbers, addition of sets, commutativity of addition, sums to 10, fact families (including subtraction), three models of subtraction ("take away", comparative, missing addend), and bar graphs. Includes student activity sheets and a link to an online graphing applet.
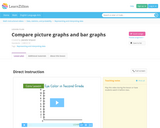
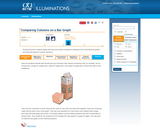
In this lesson plan students learn to create bar graphs using unifix …
In this lesson plan students learn to create bar graphs using unifix cubes, translate this representation to graph paper, and then compare the data that has been collected and displayed. Students are encouraged to make up their own questions about the data (favorite juice) and to practice with multiple sets of data. Sample questions for students and extension ideas are included. The lesson contains links to a PDF of graph paper and the Bar Grapher tool which is cataloged separately in this database.
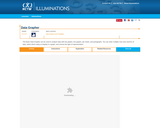
Students use this interactive tool to explore the connections between data sets …
Students use this interactive tool to explore the connections between data sets and their representations in charts and graphs. Enter data in a table (1 to 6 columns, unlimited rows), and preview or print bar graphs, line graphs, pie charts, and pictographs. Students can select which set(s) of data to display in each graph, and compare the effects of different representations of the same data. Instructions and exploration questions are provided using the expandable "+" signs above the tool.
In this unit, students use online pan balances to study equality, order …
In this unit, students use online pan balances to study equality, order of operations, numerical and variable expressions, and other key algebraic concepts. Lessons focus on balancing shapes to study equality and equivalence; balancing algebraic understanding, to explore simplifying expressions; and balancing algebra, to determine if algebraic expressions are equal.
Module 7 presents an opportunity for students to practice addition and subtraction …
Module 7 presents an opportunity for students to practice addition and subtraction strategies within 100 and problem-solving skills as they learn to work with various types of units within the contexts of length, money, and data. Students represent categorical and measurement data using picture graphs, bar graphs, and line plots. They revisit measuring and estimating length from Module 2, though now using both metric and customary units.
Find the rest of the EngageNY Mathematics resources at https://archive.org/details/engageny-mathematics.
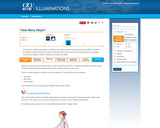
In this lesson activity students use nonstandard units (baby steps) to measure …
In this lesson activity students use nonstandard units (baby steps) to measure lengths of different types of "steps" (giant, regular, umbrella, scissor, wooden-soldier, and backwards steps). Once each student gathers this data they will display their own data on a bar graph. Then the class will discuss the data and compare graphs among students. A students worksheet for data collection is included in PDF format.
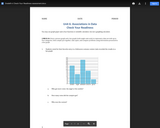
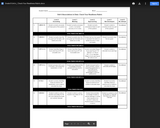
This Check Your Readiness Assessment is used in conjunction with the Illustrative …
This Check Your Readiness Assessment is used in conjunction with the Illustrative Mathematics Curriculum. It breaks down identifying the Essential Standard associated. This assessment should be utilized with the uploaded rubric to determine levels of prerequisite skills when beginning a new unit and allow for placement of interventions.
This Check Your Readiness Rubric is used in conjunction with the Illustrative …
This Check Your Readiness Rubric is used in conjunction with the Illustrative Mathematics Curriculum. It breaks down each question by identifying the Essential Standard associated and then defining what an Advanced, Proficient, Basic or Below Basic student response would entail. This rubric can then be utilized to determine levels of prerequisite skills when beginning a new unit and allow for placement of interventions.
This unit focuses on measurement and data for second-grade. The second-graders learn …
This unit focuses on measurement and data for second-grade. The second-graders learn how to accurately measure natural objects using nonstandard units (unifix cubes) and standard units (inches). During field experiences, the students learned how to use field guides and how to collect data for a BioBlitz. Students used their data to create bar graphs, picture graphs, and analyzed their data.
(Nota: Esta es una traducción de un recurso educativo abierto creado por …
(Nota: Esta es una traducción de un recurso educativo abierto creado por el Departamento de Educación del Estado de Nueva York (NYSED) como parte del proyecto "EngageNY" en 2013. Aunque el recurso real fue traducido por personas, la siguiente descripción se tradujo del inglés original usando Google Translate para ayudar a los usuarios potenciales a decidir si se adapta a sus necesidades y puede contener errores gramaticales o lingüísticos. La descripción original en inglés también se proporciona a continuación.)
El módulo 7 presenta una oportunidad para que los estudiantes practiquen estrategias de adición y sustracción dentro de 100 y habilidades de resolución de problemas a medida que aprenden a trabajar con varios tipos de unidades dentro de los contextos de longitud, dinero y datos. Los estudiantes representan datos categóricos y de medición utilizando gráficos de imágenes, gráficos de barras y parcelas de línea. Revisan la medición y la longitud de estimación del módulo 2, aunque ahora utilizan unidades métricas y habituales.
Encuentre el resto de los recursos matemáticos de Engageny en https://archive.org/details/engageny-mathematics.
English Description: Module 7 presents an opportunity for students to practice addition and subtraction strategies within 100 and problem-solving skills as they learn to work with various types of units within the contexts of length, money, and data. Students represent categorical and measurement data using picture graphs, bar graphs, and line plots. They revisit measuring and estimating length from Module 2, though now using both metric and customary units.
Find the rest of the EngageNY Mathematics resources at https://archive.org/details/engageny-mathematics.
In this unit of five lessons from NCTM's Illuminations, students explore the …
In this unit of five lessons from NCTM's Illuminations, students explore the numbers of letters in their names and create bar graphs, pictographs, circle graphs, and glyphs. They also find the range, compute measures of center, and create box-and-whisker plots. Individual lessons link to related tools where appropriate, and include questions for students, assessment options, teacher reflection questions, and sometimes extensions.
No restrictions on your remixing, redistributing, or making derivative works. Give credit to the author, as required.
Your remixing, redistributing, or making derivatives works comes with some restrictions, including how it is shared.
Your redistributing comes with some restrictions. Do not remix or make derivative works.
Most restrictive license type. Prohibits most uses, sharing, and any changes.
Copyrighted materials, available under Fair Use and the TEACH Act for US-based educators, or other custom arrangements. Go to the resource provider to see their individual restrictions.