This lesson unit is intended to help teachers assess how well students …
This lesson unit is intended to help teachers assess how well students are able to visualize two-dimensional cross-sections of representations of three-dimensional objects. In particular, the lesson will help you identify and help students who have difficulties recognizing and drawing two-dimensional cross-sections at different points along a plane of a representation of a three-dimensional object.
This lesson unit is intended to help teachers assess how well students …
This lesson unit is intended to help teachers assess how well students are able to: work with concepts of congruency and similarity, including identifying corresponding sides and corresponding angles within and between triangles; Identify and understand the significance of a counter-example; Prove, and evaluate proofs in a geometric context.
The three teachers of the third and fourth grade team joined forces …
The three teachers of the third and fourth grade team joined forces to create these standards-aligned resources. We discussed a middle-school curriculum unit, Birds & Flight, that one of us had written about fifteen years ago regarding using math to study and understand birds in different ways. As a team, we translated some of those concepts into middle-elementary activities.We discussed that the lessons could be taught in any order, but recommend using the Actual Size lesson as a fun capstone project.
This Flash tool allows students to make a box plot of their …
This Flash tool allows students to make a box plot of their data, using up to four categories of their own choosing, or using one of the data sets provided. The tool will plot all the data together, or break it out by category. Students can set a multiple of the Interquartile Range to be the Extreme Range, and exclude that data from the graph if they wish. Associated lessons (free) and a Mathematics Assessment Sampler (for purchase) are linked at the right side of the page.
This unit contains two lessons which help students develop number sense through …
This unit contains two lessons which help students develop number sense through activities involving collection, representation, and analysis of data. Students also practice reading and writing large numbers and develop estimation skills. In Lesson 1, Every Breath You Take, students estimate the number of breaths taken during a specified time, experiment, and display real-life data. In Lesson 2, Making Your First Millions, students develop the concept of a million by working with smaller numerical units, such as blocks of 10 or 100, and then expanding the idea by multiplication or repeated addition. They analyze situations and identify patterns that will enable them to develop the concept of large numbers. Each lesson includes student activity sheets, an instructional plan, and extensions.
Students use this interactive tool to explore the connections between data sets …
Students use this interactive tool to explore the connections between data sets and their representations in charts and graphs. Enter data in a table (1 to 6 columns, unlimited rows), and preview or print bar graphs, line graphs, pie charts, and pictographs. Students can select which set(s) of data to display in each graph, and compare the effects of different representations of the same data. Instructions and exploration questions are provided using the expandable "+" signs above the tool.
This lesson unit is intended to help assess how well students are …
This lesson unit is intended to help assess how well students are able to interpret and use scale drawings to plan a garden layout. This involves using proportional reasoning and metric units.
This lesson unit is intended to help teachers assess how well students …
This lesson unit is intended to help teachers assess how well students are able to: use the Pythagorean theorem to derive the equation of a circle; and translate between the geometric features of circles and their equations.
This Illuminations activity focuses on making predictions and the collection and analysis …
This Illuminations activity focuses on making predictions and the collection and analysis of data by having students take their pulse after different exercises. All individual data is collected in a classroom chart where the results are interpreted and conclusions drawn. The lesson includes a student worksheet and extension questions.
This unit of four lessons from NCTM's Illuminations lets students conduct surveys …
This unit of four lessons from NCTM's Illuminations lets students conduct surveys and represent data in a variety of ways. They also find and compare measures of center. The lessons center around a food court, where students create and use menus in a meaningful way. Topics covered include bar graphs, line plots, and pictographs, measures of center, and probability of events. Individual lessons link to related tools where appropriate, and include questions for students, assessment options, and teacher reflection questions.
This lesson unit is intended to help teachers assess how well students …
This lesson unit is intended to help teachers assess how well students are able to: articulate verbally the relationships between variables arising in everyday contexts; translate between everyday situations and sketch graphs of relationships between variables; interpret algebraic functions in terms of the contexts in which they arise; and reflect on the domains of everyday functions and in particular whether they should be discrete or continuous.
This unit includes five nature journaling experiences implemented at High Marq Environmental …
This unit includes five nature journaling experiences implemented at High Marq Environmental Charter School during the 2021-22 school year. They are a bit of a grab bag in terms of subject and skills focus, but all included practices from How to Teach Nature Journaling by Emilie Lygren and John Muir Laws. Please Remix this template for your purposes.
This google slide presentation describes a numeracy routine for grade 1 use …
This google slide presentation describes a numeracy routine for grade 1 use during the second quarter. The routine involves sequencing various representations of numbers on a clothesline. Printable materials are included.
This google slide presentation describes a numeracy routine for grade 1 use …
This google slide presentation describes a numeracy routine for grade 1 use during the first quarter. The routine involves sequencing various representations of numbers on a clothesline. Printable materials are included.
This google slide presentation describes a numeracy routine for grade 1 use …
This google slide presentation describes a numeracy routine for grade 1 use during the third quarter. The routine involves sequencing various representations of numbers on a clothesline. Printable materials are included. The items used build upon those used in the first quarter of the year.
This google slide presentation describes a numeracy routine for grade 2 use …
This google slide presentation describes a numeracy routine for grade 2 use during the first quarter. The routine involves sequencing various representations of numbers on a clothesline. Printable materials are included.
This google slide presentation describes a numeracy routine for grade 2 use …
This google slide presentation describes a numeracy routine for grade 2 use during the second quarter. The routine involves sequencing various representations of numbers on a clothesline. Printable materials are included.
This google slide presentation describes a numeracy routine for grade 2 use …
This google slide presentation describes a numeracy routine for grade 2 use during the third quarter. The routine involves sequencing various representations of numbers on a clothesline. Printable materials are included.
In Module 3, students' understanding of addition and subtraction of fractions extends …
In Module 3, students' understanding of addition and subtraction of fractions extends from earlier work with fraction equivalence and decimals. This module marks a significant shift away from the elementary grades' centrality of base ten units to the study and use of the full set of fractional units from Grade 5 forward, especially as applied to algebra.
Find the rest of the EngageNY Mathematics resources at https://archive.org/details/engageny-mathematics.
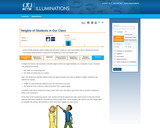
This lesson, from Illuminations, gives students practice in measurement and in displaying …
This lesson, from Illuminations, gives students practice in measurement and in displaying and interpreting data through box-and-whisker plots. Students may draw the plots themselves or use the online Box Plotter tool. Learning objectives, materials, student questions, extensions, teacher reflections, and NCTM Standards alignment are provided.
No restrictions on your remixing, redistributing, or making derivative works. Give credit to the author, as required.
Your remixing, redistributing, or making derivatives works comes with some restrictions, including how it is shared.
Your redistributing comes with some restrictions. Do not remix or make derivative works.
Most restrictive license type. Prohibits most uses, sharing, and any changes.
Copyrighted materials, available under Fair Use and the TEACH Act for US-based educators, or other custom arrangements. Go to the resource provider to see their individual restrictions.