This task examines, from a mathematical and statistical point of view, how …
This task examines, from a mathematical and statistical point of view, how scientists measure the age of organic materials by measuring the ratio of Carbon 14 to Carbon 12. The focus here is on the statistical nature of such dating. This task addresses a very important issue about precision in reporting and understanding statements in a realistic scientific context.
In this module, students reconnect with and deepen their understanding of statistics …
In this module, students reconnect with and deepen their understanding of statistics and probability concepts first introduced in Grades 6, 7, and 8. Students develop a set of tools for understanding and interpreting variability in data, and begin to make more informed decisions from data. They work with data distributions of various shapes, centers, and spreads. Students build on their experience with bivariate quantitative data from Grade 8. This module sets the stage for more extensive work with sampling and inference in later grades.
Find the rest of the EngageNY Mathematics resources at https://archive.org/details/engageny-mathematics.
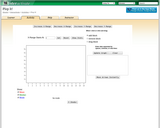
This Desmos activity provides an interactive opportunity for students to work with …
This Desmos activity provides an interactive opportunity for students to work with data as represented between data and the box plot that results from it. Students walk through an investigation on interpreting center, spread, and the impact of outliers on various box plots. Students will also use their inference skills to compare two box plots. The teacher has the ability to pace students on slides, pause them, and promote whole class discussion based upon individual student responses. The teacher can also anonymize students names to provide for more risk taking in their responses.Students may be reminded of their prior knowledge of a box plot from middle school before starting this lesson.This original lesson was created by Bob Lochel and modified by Emily O'Brien.
Students will watch videos of candle burning as the vehicle to explore …
Students will watch videos of candle burning as the vehicle to explore line of best fit.
Learning Target: I will learn how to make predictions via interpolation and extrapolation using scatter plots and a line of best fit.
Success Criteria: Students will be able recognize that there is a strong correlation and causation between candle burning and time. They will also be able to develop an equation form a line of best fit.
Students groups create scientific research posters to professionally present the results of …
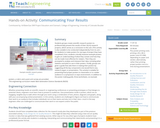
Students groups create scientific research posters to professionally present the results of their AQ-IQ research projects, which serves as a conclusion to the unit. (This activity is also suitable to be conducted independently from its unit—for students to make posters for any type of project they have completed.) First, students critically examine example posters to gain an understanding of what they contain and how they can be made most effective for viewers. Then they are prompted to analyze and interpret their data, including what statistics and plots to use in their posters. Finally, groups are given a guide that aids them in making their posters by suggesting all the key components one would find in any research paper or presentation. This activity is suitable for presenting final project posters to classmates or to a wider audience in a symposium or expo environment. In addition to the poster-making guide, three worksheets, six example posters, a rubric and a post-unit survey are provided.
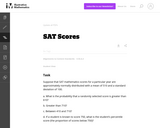
This task requires students to use the normal distribution as a model …
This task requires students to use the normal distribution as a model for a data distribution. Students must use given means and standard deviations to approximate population percentages. There are several ways (tables, graphing calculators, or statistical software) that students might calculate the required normal percentages. Depending on the method used, answers might vary somewhat from those shown in the solution.
This problem could be used as an introductory lesson to introduce group …
This problem could be used as an introductory lesson to introduce group comparisons and to engage students in a question they may find amusing and interesting. More generally, the idea of the lesson could be used as a template for a project where students develop a questionnaire, sample students at their school and report on their findings.
This lesson unit is intended to help teachers assess how well students …
This lesson unit is intended to help teachers assess how well students are able to: interpret data and evaluate statistical summaries; and critique someone elseŐs interpretations of data and evaluations of statistical summaries. The lesson also introduces students to the dangers of misapplying simple statistics in real-world contexts, and illustrates some of the common abuses of statistics and charts found in the media.
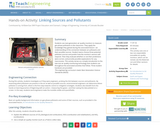
Students use next-generation air quality monitors to measure gas-phase pollutants in the …
Students use next-generation air quality monitors to measure gas-phase pollutants in the classroom. They apply the knowledge they gained during the associated lesson—an understanding of the connection between air pollutants and their possible sources. Student teams choose three potential pollutant sources and predict how the monitor’s sensors will respond. Then they evaluate whether or not their predictions were correct, and provide possible explanations for any inaccuracies. This activity serves as a simple introduction to the low-cost air quality monitoring technology that students use throughout the associated activities that follow. Three student handouts are provided.
This applet allows the user to investigate the mean, median, and box-and-whisker …
This applet allows the user to investigate the mean, median, and box-and-whisker plot for a set of data that they create. The data set may contain up to 15 integers, each with a value from 0 to 100.
PlopIt allows users to build dot plots of data using the mouse. …
PlopIt allows users to build dot plots of data using the mouse. View how the mean, median, and mode change as entries are added to the plot. Parameters: Range for observations.
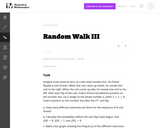
This task provides a context to calculate discrete probabilities and represent them …
This task provides a context to calculate discrete probabilities and represent them on a bar graph. It could also be used to create a class activity where students gather, represent, and analyze data, running simulations of the random walk and recording and then displaying their results.
The purpose of this task is to have students complete normal distribution …
The purpose of this task is to have students complete normal distribution calculations and to use properties of normal distributions to draw conclusions. The task is designed to encourage students to communicate their findings in a narrative/report form in context Đ not just simply as a computed number.
The purpose of this task is to allow students to demonstrate an …
The purpose of this task is to allow students to demonstrate an ability to construct boxplots and to use boxplots as the basis for comparing distributions. The solution should directly compare the center, spread, and shape of the two distributions and comment on the high outlier in the northbound data set.
This activity displays a stem and leaf plot representing data either entered …
This activity displays a stem and leaf plot representing data either entered by the user or generated by the computer. The user can use the applet as a tool that creates a stem and leaf plot from data the user inputs, or to practice calculating the mean, median, and mode of a given data set.
Students build on their existing air quality knowledge and a description of …
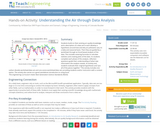
Students build on their existing air quality knowledge and a description of a data set to each develop a hypothesis around how and why air pollutants vary on a daily and seasonal basis. Then they are guided by a worksheet through an Excel-based analysis of the data. This includes entering formulas to calculate statistics and creating plots of the data. As students complete each phase of the analysis, reflection questions guide their understanding of what new information the analysis reveals. At activity end, students evaluate their original hypotheses and “put all of the pieces together.” The activity includes one carbon dioxide worksheet/data set and one ozone worksheet/data set; providing students and/or instructors with a content option. The activity also serves as a good standalone introduction to using Excel.
(Nota: Esta es una traducción de un recurso educativo abierto creado por …
(Nota: Esta es una traducción de un recurso educativo abierto creado por el Departamento de Educación del Estado de Nueva York (NYSED) como parte del proyecto "EngageNY" en 2013. Aunque el recurso real fue traducido por personas, la siguiente descripción se tradujo del inglés original usando Google Translate para ayudar a los usuarios potenciales a decidir si se adapta a sus necesidades y puede contener errores gramaticales o lingüísticos. La descripción original en inglés también se proporciona a continuación.)
En este módulo, los estudiantes reconectan y profundizan su comprensión de las estadísticas y los conceptos de probabilidad introducidos por primera vez en los grados 6, 7 y 8. Los estudiantes desarrollan un conjunto de herramientas para comprender e interpretar la variabilidad en los datos, y comienzan a tomar decisiones más informadas de los datos . Trabajan con distribuciones de datos de varias formas, centros y diferenciales. Los estudiantes se basan en su experiencia con datos cuantitativos bivariados del grado 8. Este módulo prepara el escenario para un trabajo más extenso con muestreo e inferencia en calificaciones posteriores.
Encuentre el resto de los recursos matemáticos de Engageny en https://archive.org/details/engageny-mathematics.
English Description: In this module, students reconnect with and deepen their understanding of statistics and probability concepts first introduced in Grades 6, 7, and 8. Students develop a set of tools for understanding and interpreting variability in data, and begin to make more informed decisions from data. They work with data distributions of various shapes, centers, and spreads. Students build on their experience with bivariate quantitative data from Grade 8. This module sets the stage for more extensive work with sampling and inference in later grades.
Find the rest of the EngageNY Mathematics resources at https://archive.org/details/engageny-mathematics.
No restrictions on your remixing, redistributing, or making derivative works. Give credit to the author, as required.
Your remixing, redistributing, or making derivatives works comes with some restrictions, including how it is shared.
Your redistributing comes with some restrictions. Do not remix or make derivative works.
Most restrictive license type. Prohibits most uses, sharing, and any changes.
Copyrighted materials, available under Fair Use and the TEACH Act for US-based educators, or other custom arrangements. Go to the resource provider to see their individual restrictions.