
This task helps children explore multidigit computation with arrays and/or repeated addition.
- Subject:
- Elementary Education
- Material Type:
- Activity/Lab
- Author:
- RunningHorse Livingston
- Date Added:
- 05/19/2023

This task helps children explore multidigit computation with arrays and/or repeated addition.
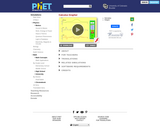
Draw a graph of any function and see graphs of its derivative and integral. Don't forget to use the magnify/demagnify controls on the y-axis to adjust the scale.
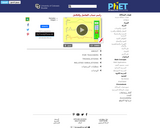
Draw a graph of any function and see graphs of its derivative and integral. Don't forget to use the magnify/demagnify controls on the y-axis to adjust the scale.
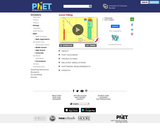
With your mouse, drag data points and their error bars, and watch the best-fit polynomial curve update instantly. You choose the type of fit: linear, quadratic, cubic, or quartic. The reduced chi-square statistic shows you when the fit is good. Or you can try to find the best fit by manually adjusting fit parameters.
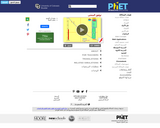
With your mouse, drag data points and their error bars, and watch the best-fit polynomial curve update instantly. You choose the type of fit: linear, quadratic, cubic, or quartic. The reduced chi-square statistic shows you when the fit is good. Or you can try to find the best fit by manually adjusting fit parameters.
This lesson unit is intended to help teachers assess how well students are able to: Select appropriate mathematical methods to use for an unstructured problem; interpret a problem situation, identifying constraints and variables, and specify assumptions; work with 2- and 3-dimensional shapes to solve a problem involving capacity and surface area; and communicate their reasoning clearly.
This lesson unit is intended to help assess how well students are able to interpret and use scale drawings to plan a garden layout. This involves using proportional reasoning and metric units.
This lesson unit is intended to help you assess how well students are able to: solve simple problems involving ratio and direct proportion; choose an appropriate sampling method; and collect discrete data and record them using a frequency table.
This lesson unit is intended to help you assess how well students are able to: Model a situation; make sensible, realistic assumptions and estimates; and use assumptions and estimates to create a chain of reasoning, in order to solve a practical problem.

In this lesson students will learn about what is a balanced and healthy meal from around the world. They will then try their hand at creating a school lunch for the quarter end celebration that is balanced and healthy. Students will supply the cooks with a recipe to follow that has been increased to accomodate the grade level as well as the potential cost to prepare that meal. By engaging in a decision matrix a single lunch will be presented to the principal and kitchen staff for consideration.

This resource is intended to provide information about Mathematical Modeling and how it was used in my classroom over the past few months. It contains the basics of math modeling as well as resources to implement a specific making task.

Infographic to be used by teachers in indentifying instructional routines and types of tasks to support students' development of mathematical modeling skills.

This lesson unit is intended to help you assess how well students are able to: Interpret a situation and represent the variables mathematically; select appropriate mathematical methods to use; explore the effects on the area of a rectangle of systematically varying the dimensions whilst keeping the perimeter constant; interpret and evaluate the data generated and identify the optimum case; and communicate their reasoning clearly.
This lesson unit is intended to help teachers assess how well students are able to: make sense of a real life situation and decide what math to apply to the problem; understand and calculate the conditional probability of an event A, given an event B, and interpret the answer in terms of a model; represent events as a subset of a sample space using tables, tree diagrams, and Venn diagrams; and interpret the results and communicate their reasoning clearly.
This lesson unit is intended to help teachers assess how well students are able to: interpret a situation and represent the constraints and variables mathematically; select appropriate mathematical methods to use; explore the effects of systematically varying the constraints; interpret and evaluate the data generated and identify the optimum case, checking it for confirmation; and communicate their reasoning clearly.
This lesson unit is intended to help sixth grade teachers assess how well students are able to: Analyze a realistic situation mathematically; construct sight lines to decide which areas of a room are visible or hidden from a camera; find and compare areas of triangles and quadrilaterals; and calculate and compare percentages and/or fractions of areas.
![[Original size] Exploring Mathematical Models Through Visuals](https://img.oercommons.org/160x134/microsite-wi-prod/media/screenshots/52617ead01d09cf2ff05e4731bd703c0e98f823a25caf1bab6812e1a363d20aa.png)
Overview: This is one page document to help clarify the practice/action of math modeling in school for administrators, as a way to show the importance of math modeling. Wisconsin resource inspired by math modeling information and resources at www.eqstemm.org.
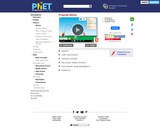
Blast a Buick out of a cannon! Learn about projectile motion by firing various objects. Set the angle, initial speed, and mass. Add air resistance. Make a game out of this simulation by trying to hit a target.
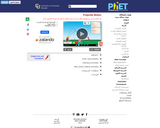
Blast a Buick out of a cannon! Learn about projectile motion by firing various objects. Set the angle, initial speed, and mass. Add air resistance. Make a game out of this simulation by trying to hit a target.