I use this to help students memorize the information they need to …
I use this to help students memorize the information they need to know for making conversions. Tools and charts are not always available so this will help students focus on the information that they should memorize so they could complete the conversions without using a tool or a chart.I spend time on the memorizing after much instruction and practice with the metric and customary units. So both metric and customary units are included in this memoriztion practice.
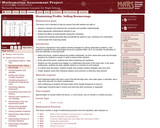
This lesson unit is intended to help teachers assess how well students …
This lesson unit is intended to help teachers assess how well students are able to: interpret a situation and represent the constraints and variables mathematically; select appropriate mathematical methods to use; explore the effects of systematically varying the constraints; interpret and evaluate the data generated and identify the optimum case, checking it for confirmation; and communicate their reasoning clearly.
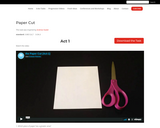
Which piece of paper has a greater area? This 3 Act Task …
Which piece of paper has a greater area? This 3 Act Task by Graham Fletcher begins with a short portion of a video. A sheet of paper is cut apart leaving the center piece and an outer border piece. First students make observations and estimates to begin determining which piece of paper has a greater area. Students can then use images of the original paper and the middle cut piece of paper along with a measuring tool with square units to determine the area of the pieces. Students are estimating, measuring, multiplying, adding, and subtracting to determine the area of each piece of paper.
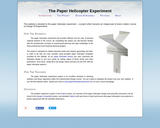
The paper helicopter experiment lab provides efficient and fun way of learning …
The paper helicopter experiment lab provides efficient and fun way of learning material relevant to the course. By completing the project you will become familiar with the fundamental concepts of experimental planning and gain knowledge of the theory behind two-level fractional factorial designs.
The project is designed to imitate industrial needs and requires generating real data. In order to do that you may consider using printable paper helicopter templates provided by this website. At our paper helicopter factory you may customize the helicopter design to suit your needs by setting values of factor levels and other parameters. Once done, simply fill in the design matrix and print out the PDF with the paper helicopter patterns.
The purpose of this task is for students to select 2 numbers …
The purpose of this task is for students to select 2 numbers from a set of 3 that sum to 9. The task can be completed for sums equaling any number. Teachers may choose to ask students to write the simple equations they select.
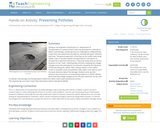
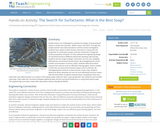
Acting as civil engineers hired by the U.S. Department of Transportation to …
Acting as civil engineers hired by the U.S. Department of Transportation to research how to best use piezoelectric materials to detect road damage, student groups are challenged to independently create their own experiment procedures, working with given materials and tools. The general approach is that they set up model roads using rubber mats to simulate asphalt and piezoelectric transducers to simulate the in-ground road sensors. They drop heavy bolts at various locations on the “road,” collecting data and then analyzing the voltage changes across the piezoelectric transducers caused by the vibrations of the bolt hitting the rubber. After making notches in the rubber “road” to simulate cracks and potholes, they collect more data to see if the piezo elements detect the damage. Students write up their research and conclusions as if presenting evidence to USDOT officials about how the voltage changes across the piezo elements can be used to indicate road damage and extrapolated to determine when roads need maintenance service.
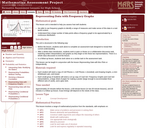
This lesson unit is intended to help teachers assess how well students: …
This lesson unit is intended to help teachers assess how well students: are able to use frequency graphs to identify a range of measures and make sense of this data in a real-world context; and understand that a large number of data points allow a frequency graph to be approximated by a continuous distribution.
This lesson unit is intended to help teachers assess how well students …
This lesson unit is intended to help teachers assess how well students are able to interpret data using frequency graphs and box plots. In particular this unit aims to identify and help students who have difficulty figuring out the data points and spread of data from frequency graphs and box plots. It is advisable to use the lesson: Representing Data 1: Frequency Graphs, before this one.
Students conduct an experiment to determine the relationship between the speed of …
Students conduct an experiment to determine the relationship between the speed of a wooden toy car at the bottom of an incline and the height at which it is released. They observe how the photogate-based speedometer instrument "clocks" the average speed of an object (the train). They gather data and create graphs plotting the measured speed against start height. After the experiment, as an optional extension activity, students design brakes to moderate the speed of the cart at the bottom of the hill to within a specified speed range.
This lesson explores the increase in energy use and cost due to …
This lesson explores the increase in energy use and cost due to a building expansion for an additional 150 students. The lesson was created by David Luety. It is developed for use with Sketchbox, a free building energy modeling tool that runs from a web interface and does not require a download.
Students build scale models of objects of their choice. In class they …
Students build scale models of objects of their choice. In class they measure the original object and pick a scale, deciding either to scale it up or scale it down. Then they create the models at home. Students give two presentations along the way, one after their calculations are done, and another after the models are completed. They learn how engineers use scale models in their designs of structures, products and systems. Two student worksheets as well as rubrics for project and presentation expectations and grading are provided.
Students learn how different characteristics of shapes—side lengths, perimeter and area—change when …
Students learn how different characteristics of shapes—side lengths, perimeter and area—change when the shapes are scaled, either enlarged or reduced. Student pairs conduct a “scaling investigation” to measure and calculate shape dimensions (rectangle, quarter circle, triangle; lengths, perimeters, areas) from a bedroom floorplan provided at three scales. They analyze their data to notice the mathematical relationships that hold true during the scaling process. They see how this can be useful in real-world situations like when engineers design wearable or implantable biosensors. This prepares students for the associated activity in which they use this knowledge to help them reduce or enlarge their drawings as part of the process of designing their own wearables products. Pre/post-activity quizzes, a worksheet and wrap-up concepts handout are provided.
Student teams are challenged to evaluate the design of several liquid soaps …
Student teams are challenged to evaluate the design of several liquid soaps to answer the question, “Which soap is the best?” Through two simple teacher class demonstrations and the activity investigation, students learn about surface tension and how it is measured, the properties of surfactants (soaps), and how surfactants change the surface properties of liquids. As they evaluate the engineering design of real-world products (different liquid dish washing soap brands), students see the range of design constraints such as cost, reliability, effectiveness and environmental impact. By investigating the critical micelle concentration of various soaps, students determine which requires less volume to be an effective cleaning agent, factors related to both the cost and environmental impact of the surfactant. By investigating the minimum surface tension of the soap, students determine which dissolves dirt and oil most effectively and thus cleans with the least effort. Students evaluate these competing criteria and make their own determination as to which of five liquid soaps make the “best” soap, giving their own evidence and scientific reasoning. They make the connection between gathered data and the real-world experience in using these liquid soaps.
This lesson introduces Sketchbox™, a free energy modeling tool that calculates energy …
This lesson introduces Sketchbox™, a free energy modeling tool that calculates energy use in buildings. Sketchbox™ can run online from a Chromebook with no downloads needed. This activity is for those teaching in math, science, construction, HVAC, sustainability, or computer science. Online tutorials are available, and the platform is ideal for student exploration of building science and various careers ranging from architecture to engineering. Sketchbox was created by Slipstream—a nonprofit organization based in Madison, WI, and curriculum is from the Center for Renewable Energy Advanced Technological Education (CREATE).
This activity builds on Sort and Count I. It also helps students …
This activity builds on Sort and Count I. It also helps students become familiar with the math vocabulary more/less/same and most/least as they sort, count, and compare small groups of objects.
No restrictions on your remixing, redistributing, or making derivative works. Give credit to the author, as required.
Your remixing, redistributing, or making derivatives works comes with some restrictions, including how it is shared.
Your redistributing comes with some restrictions. Do not remix or make derivative works.
Most restrictive license type. Prohibits most uses, sharing, and any changes.
Copyrighted materials, available under Fair Use and the TEACH Act for US-based educators, or other custom arrangements. Go to the resource provider to see their individual restrictions.