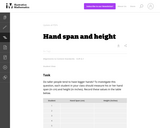
This task uses student generated data to assess standard 7.SP.7. This task …
This task uses student generated data to assess standard 7.SP.7. This task could also be extended to address Standard 7.SP.1 by adding a small or whole class discussion of whether the class could be considered as a representative sample of all students at your school.
This course is an introduction to data cleaning, analysis and visualization. We …
This course is an introduction to data cleaning, analysis and visualization. We will teach the basics of data analysis through concrete examples. You will learn how to take raw data, extract meaningful information, use statistical tools, and make visualizations. This was offered as a non-credit course during the Independent Activities Period (IAP), which is a special 4-week term at MIT that runs from the first week of January until the end of the month.
This is a task from the Illustrative Mathematics website that is one …
This is a task from the Illustrative Mathematics website that is one part of a complete illustration of the standard to which it is aligned. Each task has at least one solution and some commentary that addresses important aspects of the task and its potential use.
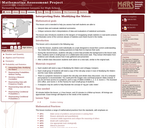
This lesson unit is intended to help teachers assess how well students …
This lesson unit is intended to help teachers assess how well students are able to: interpret data and evaluate statistical summaries; and critique someone elseŐs interpretations of data and evaluations of statistical summaries. The lesson also introduces students to the dangers of misapplying simple statistics in real-world contexts, and illustrates some of the common abuses of statistics and charts found in the media.
This course provides graduate students in the sciences with an intensive introduction …
This course provides graduate students in the sciences with an intensive introduction to applied statistics. Topics include descriptive statistics, probability, non-parametric methods, estimation methods, hypothesis testing, correlation and linear regression, simulation, and robustness considerations. Calculations will be done using handheld calculators and the Minitab Statistical Computer Software.
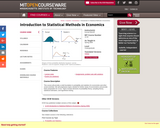
" This course will provide a solid foundation in probability and statistics …
" This course will provide a solid foundation in probability and statistics for economists and other social scientists. We will emphasize topics needed for further study of econometrics and provide basic preparation for 14.32. Topics include elements of probability theory, sampling theory, statistical estimation, and hypothesis testing."
This course covers descriptive statistics, the foundation of statistics, probability and random …
This course covers descriptive statistics, the foundation of statistics, probability and random distributions, and the relationships between various characteristics of data. Upon successful completion of the course, the student will be able to: Define the meaning of descriptive statistics and statistical inference; Distinguish between a population and a sample; Explain the purpose of measures of location, variability, and skewness; Calculate probabilities; Explain the difference between how probabilities are computed for discrete and continuous random variables; Recognize and understand discrete probability distribution functions, in general; Identify confidence intervals for means and proportions; Explain how the central limit theorem applies in inference; Calculate and interpret confidence intervals for one population average and one population proportion; Differentiate between Type I and Type II errors; Conduct and interpret hypothesis tests; Compute regression equations for data; Use regression equations to make predictions; Conduct and interpret ANOVA (Analysis of Variance). (Mathematics 121; See also: Biology 104, Computer Science 106, Economics 104, Psychology 201)
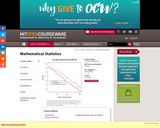
The main goal of the course is to highlight the general assumptions …
The main goal of the course is to highlight the general assumptions and methods that underlie all statistical analysis. The purpose is to get a good understanding of the scope, and the limitations of these methods. We also want to learn as much as possible about the assumptions behind the most common methods, in order to evaluate if they apply with reasonable accuracy to a given situation. Our goal is not so much learning bread and butter techniques: these are pre-programmed in widely available and used software, so much so that a mechanical acquisition of these techniques could be quickly done "on the job". What is more challenging is the evaluation of what the results of a statistical procedure really mean, how reliable they are in given circumstances, and what their limitations are.Login: guest_oclPassword: ocl
This is a task from the Illustrative Mathematics website that is one …
This is a task from the Illustrative Mathematics website that is one part of a complete illustration of the standard to which it is aligned. Each task has at least one solution and some commentary that addresses important aspects of the task and its potential use.
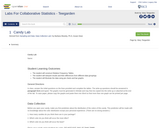
This is a collection of labs from Collaborative Statistics by Illowski and …
This is a collection of labs from Collaborative Statistics by Illowski and Dean which have been edited to include Minitab activities. In addition the labs are to be done as individual activities.
You are a material scientist who just crash-landed on an abandoned mining …
You are a material scientist who just crash-landed on an abandoned mining planet. You’re out of fuel, and your suit’s oxygen is running low. You need to mine enough fuel to power your ship, or you won’t survive.
You stumble into the old mining facility. That’s where you meet MAL, the mine’s Artificial Intelligence, who is thrilled to have someone to talk to. With MAL’s help, you’ll build scientific models to predict if you’re mining fast enough and what you need to do next.
Each level puts the student in the role of the scientific modeler. Students will set up equations, work with graphs, input data, and use models to make predictions. Along the way, as obstacles keep popping up, students will experience how models are used as a tool to make decisions.
Note: For best compatibility, use Chrome.
Use Lost at the Forever Mine to introduce units on graphing or scientific modeling. The game was designed to help kids experience the need for math to make predictions. This story-based game gives a context to why graphing, math equations, and collecting data can help us solve problems.
Try introducing a unit with this game. Let the kids figure out how the game works with little introduction. Remember, struggling to figure it out is part of the process. Games are safe places for struggle and failure to become part of the fun.
This course provides students with decision theory, estimation, confidence intervals, and hypothesis …
This course provides students with decision theory, estimation, confidence intervals, and hypothesis testing. It introduces large sample theory, asymptotic efficiency of estimates, exponential families, and sequential analysis.
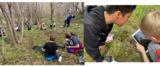
This collection of five lessons explores 3rd grade mathematical concepts in the …
This collection of five lessons explores 3rd grade mathematical concepts in the context of the outdoor classroom. These lessons span various math and science curricular units and include:Arrays in Nature (modeling multiplication)Measurement in Nature (length/mass and traits of organisms)Fraction Snow Cakes (fractions)Engineering and Design - Flight (measurement/data and forces)BioBlitzes (measurement/data, diversity and traits)
This lesson unit is intended to help teachers assess how well students …
This lesson unit is intended to help teachers assess how well students are able to: make sense of a real life situation and decide what math to apply to the problem; understand and calculate the conditional probability of an event A, given an event B, and interpret the answer in terms of a model; represent events as a subset of a sample space using tables, tree diagrams, and Venn diagrams; and interpret the results and communicate their reasoning clearly.
This lesson unit is intended to help teachers assess how well students …
This lesson unit is intended to help teachers assess how well students are able to: Understand conditional probability; represent events as a subset of a sample space using tables and tree diagrams; and communicate their reasoning clearly.
This lesson unit is intended to help teachers assess how well students …
This lesson unit is intended to help teachers assess how well students understand conditional probability, and, in particular, to help teachers identify and assist students who have the following difficulties: representing events as a subset of a sample space using tables and tree diagrams; and understanding when conditional probabilities are equal for particular and general situations.
In this class, students use data and systems knowledge to build models …
In this class, students use data and systems knowledge to build models of complex socio-technical systems for improved system design and decision-making. Students will enhance their model-building skills, through review and extension of functions of random variables, Poisson processes, and Markov processes; move from applied probability to statistics via Chi-squared t and f tests, derived as functions of random variables; and review classical statistics, hypothesis tests, regression, correlation and causation, simple data mining techniques, and Bayesian vs. classical statistics. A class project is required.
No restrictions on your remixing, redistributing, or making derivative works. Give credit to the author, as required.
Your remixing, redistributing, or making derivatives works comes with some restrictions, including how it is shared.
Your redistributing comes with some restrictions. Do not remix or make derivative works.
Most restrictive license type. Prohibits most uses, sharing, and any changes.
Copyrighted materials, available under Fair Use and the TEACH Act for US-based educators, or other custom arrangements. Go to the resource provider to see their individual restrictions.