In this module, students reconnect with and deepen their understanding of statistics …
In this module, students reconnect with and deepen their understanding of statistics and probability concepts first introduced in Grades 6, 7, and 8. Students develop a set of tools for understanding and interpreting variability in data, and begin to make more informed decisions from data. They work with data distributions of various shapes, centers, and spreads. Students build on their experience with bivariate quantitative data from Grade 8. This module sets the stage for more extensive work with sampling and inference in later grades.
Find the rest of the EngageNY Mathematics resources at https://archive.org/details/engageny-mathematics.
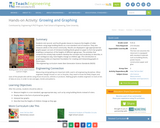
In this data analysis activity students investigate data in connection with recyclable …
In this data analysis activity students investigate data in connection with recyclable materials and develop plans to help the environment. Students collect data about aluminum can usage and graph that data in a line plot. The lesson includes student worksheet and extension suggestions.
In this math activity, learners are challenged to create aluminum foil boats …
In this math activity, learners are challenged to create aluminum foil boats that will hold plastic bears until the boats sink. The lesson serves as a fun, hands-on way to collect data. Data from two attempts is collected and used to make two class box-and-whisker plots with some surprising results. This lesson guide includes questions for learners, assessment options, extensions, and reflection questions.
Students learn a simple technique for quantifying the amount of photosynthesis that …
Students learn a simple technique for quantifying the amount of photosynthesis that occurs in a given period of time, using a common water plant (Elodea). They can use this technique to compare the amounts of photosynthesis that occur under conditions of low and high light levels. Before they begin the experiment, however, students must come up with a well-worded hypothesis to be tested. After running the experiment, students pool their data to get a large sample size, determine the measures of central tendency of the class data, and then graph and interpret the results.
Using the story "The Celebrated Jumping Frog of Calaveras County" by Mark …
Using the story "The Celebrated Jumping Frog of Calaveras County" by Mark Twain, learners simulate a jumping-frog contest and determine the distances "jumped." Learners record the distance of individual jumps in centimeters and determine the total distance jumped (the sum of the three separate jumps) and the official distance (the straight-line distance from the starting line to the end of the frog's third jump). Learners compare the range and median of the total distances with those of the official distances of the group.
This unit contains two lessons which help students develop number sense through …
This unit contains two lessons which help students develop number sense through activities involving collection, representation, and analysis of data. Students also practice reading and writing large numbers and develop estimation skills. In Lesson 1, Every Breath You Take, students estimate the number of breaths taken during a specified time, experiment, and display real-life data. In Lesson 2, Making Your First Millions, students develop the concept of a million by working with smaller numerical units, such as blocks of 10 or 100, and then expanding the idea by multiplication or repeated addition. They analyze situations and identify patterns that will enable them to develop the concept of large numbers. Each lesson includes student activity sheets, an instructional plan, and extensions.
This project-based unit on statistics provides an opportunity for problem solving through …
This project-based unit on statistics provides an opportunity for problem solving through real-world data collection and analysis. Students follow the seven- step "Elementary Mathematics Research Model" by identifying a research question, predicting the answer, and conducting research to test their hypothesis. Students use the mean, mode and median to analyze their data and use graphs to represent their findings so they can draw and justify conclusions. The lesson plan includes examples, questions for students, and possible assessment and extension ideas.
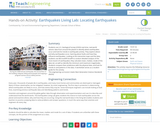
Students use U.S. Geological Survey (USGS) real-time, real-world seismic data from around …
Students use U.S. Geological Survey (USGS) real-time, real-world seismic data from around the planet to identify where earthquakes occur and look for trends in earthquake activity. They explore where and why earthquakes occur, learning about faults and how they influence earthquakes. Looking at the interactive maps and the data, students use Microsoft® Excel® to conduct detailed analysis of the most-recent 25 earthquakes; they calculate mean, median, mode of the data set, as well as identify the minimum and maximum magnitudes. Students compare their predictions with the physical data, and look for trends to and patterns in the data. A worksheet serves as a student guide for the activity.
In this 7- lesson unit students use tallies, pictographs, bar graphs, line …
In this 7- lesson unit students use tallies, pictographs, bar graphs, line plots, circle graphs, box-and-whisker plots, and glyphs to collect and display data about healthy eating. The unit includes lessons in which two sets of data are being compared and data sets are being analyzed for measures of central tendency (mean, median, mode). Learning objectives, materials, student questions, extensions, teacher reflections, and links to create graphs virtually are included.
This unit of four lessons from NCTM's Illuminations lets students conduct surveys …
This unit of four lessons from NCTM's Illuminations lets students conduct surveys and represent data in a variety of ways. They also find and compare measures of center. The lessons center around a food court, where students create and use menus in a meaningful way. Topics covered include bar graphs, line plots, and pictographs, measures of center, and probability of events. Individual lessons link to related tools where appropriate, and include questions for students, assessment options, and teacher reflection questions.
Students visit second- and fourth-grade classes to measure the heights of older …
Students visit second- and fourth-grade classes to measure the heights of older students using large building blocks as a non-standard unit of measure. They also measure adults in the school community. Results are displayed in age-appropriate bar graphs (paper cut-outs of miniature building blocks glued on paper to form bar graphs) enabling a comparison of the heights of different age groups. The activities that comprise this activity help students develop the concepts and vocabulary to describe, in a non-ambiguous way, how heights change as children age. This introduction to graphing provides an important foundation for creating and interpreting graphs in future years.
This lesson, from Illuminations, gives students practice in measurement and in displaying …
This lesson, from Illuminations, gives students practice in measurement and in displaying and interpreting data through box-and-whisker plots. Students may draw the plots themselves or use the online Box Plotter tool. Learning objectives, materials, student questions, extensions, teacher reflections, and NCTM Standards alignment are provided.
This lesson plan combines physical activity (jumping jacks) with data collection. The …
This lesson plan combines physical activity (jumping jacks) with data collection. The purpose of this activity is to compare and contrast the use of mean, median, and mode as the best measure of central tendency. The lesson plan includes three worksheets, extension questions, and assessment options.
In this math activity, learners prepare jumping jack data to send to …
In this math activity, learners prepare jumping jack data to send to officials on the planet Jumpalot. Learners record how many jumping jacks they can do in ten seconds and use their knowledge of time conversions to figure out how many jumping jacks they could complete in a minute all the way to a year. Learners then organize group data and explore mean, median, and mode and the effects extreme values have on these measures. Finally, learners brainstorm the advantages and disadvantages each measure offers. This lesson guide includes questions for learners, assessment options, extensions, and reflection questions.
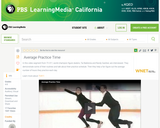
In this math meets engineering activity, learners make paper airplanes and explore …
In this math meets engineering activity, learners make paper airplanes and explore attributes related to increasing flight distances. Each learner collects data from three flights of the airplane and finds the median distance. Learners then collect, organize, display, and interpret the median distances for the group in a stem-and-leaf plot. This lesson guide includes questions for learners, assessment options, extensions, and reflection questions.
This applet allows the user to investigate the mean, median, and box-and-whisker …
This applet allows the user to investigate the mean, median, and box-and-whisker plot for a set of data that they create. The data set may contain up to 15 integers, each with a value from 0 to 100.
Students experience data collection, analysis and inquiry in this LEGO® MINDSTORMS® NXT …
Students experience data collection, analysis and inquiry in this LEGO® MINDSTORMS® NXT -based activity. They measure the position of an oscillating platform using a ultrasonic sensor and perform statistical analysis to determine the mean, mode, median, percent difference and percent error for the collected data.
In this Illuminations unit (three lessons), students formulate and refine questions that …
In this Illuminations unit (three lessons), students formulate and refine questions that can be addressed by categorical data (Lesson 1) and numerical data (Lesson 2). They then collect, organize, and display with bar and circle graphs relevant data to answer those questions. They recognize the differences in analyzing categorical and numerical data. In the final lesson students identify examples of each type of data by looking at the question asked and discover the type of data collected determines the type of data display that is the most appropriate way of representing it. Students work with partners to collect data and create graphs for both types of data using the Data Grapher (cataloged separately).
No restrictions on your remixing, redistributing, or making derivative works. Give credit to the author, as required.
Your remixing, redistributing, or making derivatives works comes with some restrictions, including how it is shared.
Your redistributing comes with some restrictions. Do not remix or make derivative works.
Most restrictive license type. Prohibits most uses, sharing, and any changes.
Copyrighted materials, available under Fair Use and the TEACH Act for US-based educators, or other custom arrangements. Go to the resource provider to see their individual restrictions.