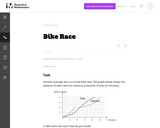
The purpose of this task is for students to interpret two distance-time …
The purpose of this task is for students to interpret two distance-time graphs in terms of the context of a bicycle race. There are two major mathematical aspects to this: interpreting what a particular point on the graph means in terms of the context, and understanding that the "steepness" of the graph tells us something about how fast the bicyclists are moving.
Introduces students to the basic tools in using data to make informed …
Introduces students to the basic tools in using data to make informed management decisions. Covers introductory probability, decision analysis, basic statistics, regression, simulation, and linear and nonlinear optimization. Computer spreadsheet exercises and examples drawn from marketing, finance, operations management, and other management functions. Restricted to Sloan Fellows.
This lesson unit is intended to help teachers assess how well students …
This lesson unit is intended to help teachers assess how well students are able to interpret exponential and linear functions and in particular to identify and help students who have the following difficulties: translating between descriptive, algebraic and tabular data, and graphical representation of the functions; recognizing how, and why, a quantity changes per unit intervale; and to achieve these goals students work on simple and compound interest problems.
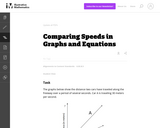
This task provides the opportunity for students to reason about graphs, slopes, …
This task provides the opportunity for students to reason about graphs, slopes, and rates without having a scale on the axes or an equation to represent the graphs. Students who prefer to work with specific numbers can write in scales on the axes to help them get started.
n addition to providing a task that relates to other disciplines (history, …
n addition to providing a task that relates to other disciplines (history, civics, current events, etc.), this task is intended to demonstrate that a graph can summarize a distribution as well as provide useful information about specific observations.
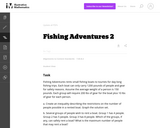
This task is the second in a series of three tasks that …
This task is the second in a series of three tasks that use inequalities in the same context at increasing complexity in 6th grade, 7th grade and in HS algebra. Students write and solve inequalities, and represent the solutions graphically.
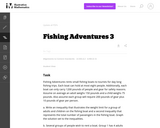
This task is the last in a series of three tasks that …
This task is the last in a series of three tasks that use inequalities in the same context at increasing complexity in 6th grade, 7th grade and in HS algebra. Students write and solve inequalities, and represent the solutions graphically. The progression of the content standards is 6.EE.8 to 7.EE.4 to A-REI.12.
This lesson unit is intended to help teachers assess how well students …
This lesson unit is intended to help teachers assess how well students are able to understand what the different algebraic forms of a quadratic function reveal about the properties of its graphical representation. In particular, the lesson will help teachers identify and help students who have the following difficulties: understanding how the factored form of the function can identify a graphŐs roots; understanding how the completed square form of the function can identify a graphŐs maximum or minimum point; and understanding how the standard form of the function can identify a graphŐs intercept.
Student teams use sensorsâmotion detectors and accelerometersâto collect walking gait data from …
Student teams use sensorsâmotion detectors and accelerometersâto collect walking gait data from group members. They import their collected position and acceleration data into Excel® for graphing and analysis to discover the relationships between position, velocity and acceleration in the walking gaits. Then they apply their understanding of slopes of secant lines and Riemann sums to generate and graph additional data. These activities provide practice in the data collection and analysis of systems, similar to the work of real-world engineers.
This lesson unit is intended to help you assess how well students …
This lesson unit is intended to help you assess how well students working with square numbers are able to: choose an appropriate, systematic way to collect and organize data, examining the data for patterns; describe and explain findings clearly and effectively; generalize using numerical, geometrical, graphical and/or algebraic structure; and explain why certain results are possible/impossible, moving towards a proof.
This 10-day module builds on Grade 2 concepts about data, graphing, and …
This 10-day module builds on Grade 2 concepts about data, graphing, and line plots. The two topics in this module focus on generating and analyzing categorical and measurement data. By the end of the module, students are working with a mixture of scaled picture graphs, bar graphs, and line plots to problem solve using both categorical and measurement data.
Find the rest of the EngageNY Mathematics resources at https://archive.org/details/engageny-mathematics.
In Module 4, students extend what they already know about unit rates …
In Module 4, students extend what they already know about unit rates and proportional relationships to linear equations and their graphs. Students understand the connections between proportional relationships, lines, and linear equations in this module. Students learn to apply the skills they acquired in Grades 6 and 7, with respect to symbolic notation and properties of equality to transcribe and solve equations in one variable and then in two variables.
Find the rest of the EngageNY Mathematics resources at https://archive.org/details/engageny-mathematics.
This task requires students to recognize the graphs of different (positive) powers …
This task requires students to recognize the graphs of different (positive) powers of x. There are several important aspects to these graphs. First, the graphs of even powers of x all open upward as x grows in the positive or negative direction. The larger the even power, the flatter these graphs look near 0 and the more rapidly they increase once the distance of x from 0 excedes 1.
This exploration can be done in class near the beginning of a …
This exploration can be done in class near the beginning of a unit on graphing parabolas. Students need to be familiar with intercepts, and need to know what the vertex is.
The goal of this task is to get students to focus on …
The goal of this task is to get students to focus on the shape of the graph of the equation y=ex and how this changes depending on the sign of the exponent and on whether the exponential is in the numerator or denominator. It is also intended to develop familiarity, in the case of f and k, with the functions which are used in logistic growth models, further examined in ``Logistic Growth Model, Explicit Case'' and ``Logistic Growth Model, Abstract Verson.''
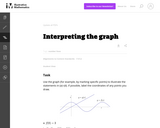
The purpose of this task is to help students learn to read …
The purpose of this task is to help students learn to read information about a function from its graph, by asking them to show the part of the graph that exhibits a certain property of the function. The task could be used to further instruction on understanding functions, or as an assessment tool with the caveat that it requires some amount of creativity to decide how to best illustrate some of the statements.
This course provides an introduction to mathematical modeling of computational problems. It …
This course provides an introduction to mathematical modeling of computational problems. It covers the common algorithms, algorithmic paradigms, and data structures used to solve these problems. The course emphasizes the relationship between algorithms and programming, and introduces basic performance measures and analysis techniques for these problems.
This is a collection of three lessons that can be added to …
This is a collection of three lessons that can be added to the lessons about energy for fourth graders after the students have created a model of the concept of transfer of energy, before or after they have discussed renewable energy as an option. Skills could be reading a map or a graph and gathering useful information, discussing it and coming up with what the information meant. Intelligence was another pursuit. Intelligence meant more than knowing things. It meant knowing things and being able to apply it to the real world as useful information and action. As you learn something, you are also aware of yourself and those around you. Knowledge is intelligence when it can be used for good in the community. It can be useful for everyone and your job is to help apply it and share it with others with this in mind. Write these two pursuits on the board and a quick definition or a student created definition.
This lesson unit is intended to help teahcers assess how well students …
This lesson unit is intended to help teahcers assess how well students are able to interpret speed as the slope of a linear graph and translate between the equation of a line and its graphical representation.
No restrictions on your remixing, redistributing, or making derivative works. Give credit to the author, as required.
Your remixing, redistributing, or making derivatives works comes with some restrictions, including how it is shared.
Your redistributing comes with some restrictions. Do not remix or make derivative works.
Most restrictive license type. Prohibits most uses, sharing, and any changes.
Copyrighted materials, available under Fair Use and the TEACH Act for US-based educators, or other custom arrangements. Go to the resource provider to see their individual restrictions.