This lesson, from Illuminations, gives students practice in measurement and in displaying …
This lesson, from Illuminations, gives students practice in measurement and in displaying and interpreting data through box-and-whisker plots. Students may draw the plots themselves or use the online Box Plotter tool. Learning objectives, materials, student questions, extensions, teacher reflections, and NCTM Standards alignment are provided.
In this lesson activity students use nonstandard units (baby steps) to measure …
In this lesson activity students use nonstandard units (baby steps) to measure lengths of different types of "steps" (giant, regular, umbrella, scissor, wooden-soldier, and backwards steps). Once each student gathers this data they will display their own data on a bar graph. Then the class will discuss the data and compare graphs among students. A students worksheet for data collection is included in PDF format.
This lesson focuses learners on the concept of 1,000,000. It allows learners …
This lesson focuses learners on the concept of 1,000,000. It allows learners to see firsthand the sheer size of 1 million, while at the same time providing learners with an introduction to sampling and its use in mathematics. Learners use grains of rice and a balance to figure out the approximate volume and weight of 1,000,000 grains of rice. This lesson guide includes questions for learners, assessment options, extensions, and reflection questions.
In this recycling activity students conduct a poll and display data showing …
In this recycling activity students conduct a poll and display data showing which type of material the survey population feels is the best for shopping bags. Students share their results in a data display of their choice and then use the data to draw conclusions and create a recycling plan. The activity includes the student worksheet, extension suggestions, and related resources.
This course is an introduction to data cleaning, analysis and visualization. We …
This course is an introduction to data cleaning, analysis and visualization. We will teach the basics of data analysis through concrete examples. You will learn how to take raw data, extract meaningful information, use statistical tools, and make visualizations. This was offered as a non-credit course during the Independent Activities Period (IAP), which is a special 4-week term at MIT that runs from the first week of January until the end of the month.
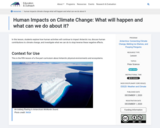
In this lesson, students explore how human activities will continue to impact …
In this lesson, students explore how human activities will continue to impact Antarctic ice, discuss human contributions to climate change, and investigate what we can do to stop/reverse these negative effects.
This activity is a guided inquiry investigation where students gather data on …
This activity is a guided inquiry investigation where students gather data on which soil is the best for growing plants. Student will interpret their data, and develop a conclusion from the data. The student will determine which type of soil they would like to use in the next activity of making their own terrariums. The data collected could lead to further questions, which can be investigated in some extension activities.
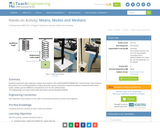
This lesson plan combines physical activity (jumping jacks) with data collection. The …
This lesson plan combines physical activity (jumping jacks) with data collection. The purpose of this activity is to compare and contrast the use of mean, median, and mode as the best measure of central tendency. The lesson plan includes three worksheets, extension questions, and assessment options.
In this math activity, learners prepare jumping jack data to send to …
In this math activity, learners prepare jumping jack data to send to officials on the planet Jumpalot. Learners record how many jumping jacks they can do in ten seconds and use their knowledge of time conversions to figure out how many jumping jacks they could complete in a minute all the way to a year. Learners then organize group data and explore mean, median, and mode and the effects extreme values have on these measures. Finally, learners brainstorm the advantages and disadvantages each measure offers. This lesson guide includes questions for learners, assessment options, extensions, and reflection questions.
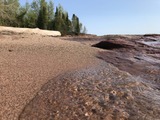
In high school, Gena and Ali set out to learn about the …
In high school, Gena and Ali set out to learn about the geophysical forces acting on Lake Superior. They wanted to investigate why they would sometimes see such dramatic fluctuations in Lake Superior water levels. They learned that large lakes exhibit a phenomenon called a seiche (pronounced saysh) and they decided to investigate how often the water switched directions and how much the water level changed because of the seiche.
This activity was evaluated using the HQIM rubric linked here https://docs.google.com/spreadsheets/d/1hZqpmXhKFV1ltE8PbdtFJzRvwcvdA-bDQ_-Kw29cci8/edit?usp=sharing
Students complete an exercise showing logarithmic relationships and examine how to find …
Students complete an exercise showing logarithmic relationships and examine how to find the linear regression of data that does not seem linear upon initial examination. They relate number of BMD scanners to time.
Introduction to "soft" consumer research methods, useful for getting quick customer input …
Introduction to "soft" consumer research methods, useful for getting quick customer input into decisions on product design and development, strategic positioning, advertising, and branding. Covers interview techniques, observational methods, Voice of the Customer, focus groups, and analyses suitable for qualitative data. Introduces new information-gathering methods in development at MIT.
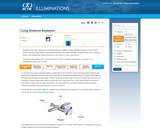
In this math meets engineering activity, learners make paper airplanes and explore …
In this math meets engineering activity, learners make paper airplanes and explore attributes related to increasing flight distances. Each learner collects data from three flights of the airplane and finds the median distance. Learners then collect, organize, display, and interpret the median distances for the group in a stem-and-leaf plot. This lesson guide includes questions for learners, assessment options, extensions, and reflection questions.
In this math lesson, learners discover a powerful way to display dataäóîusing …
In this math lesson, learners discover a powerful way to display dataäóîusing a glyph. Learners create glyphs by drawing their own faces on paper plates. Making a glyph involves the logical skill of classification--a learner must decide which groups he or she belongs to in order to complete the picture. This lesson guide includes questions for learners, assessment options, extensions, and reflection questions.
Business and Marketing activity for grades 9-12 relating to Market Research. Students …
Business and Marketing activity for grades 9-12 relating to Market Research. Students will prepare a taste test for the class. Conduct a Google survey and determine consumer preferences and report the results back to the class using visual aids.
In this unit plan students apply their knowledge of data collection, display, …
In this unit plan students apply their knowledge of data collection, display, and analysis to create a plan for improving the environment. Each of the four lessons in this unit requires students to collect data about recyclable materials and display the data for analysis. Each lesson includes students worksheets (PDF), discussion questions, and extension ideas.
This applet allows the user to investigate the mean, median, and box-and-whisker …
This applet allows the user to investigate the mean, median, and box-and-whisker plot for a set of data that they create. The data set may contain up to 15 integers, each with a value from 0 to 100.
Students experience data collection, analysis and inquiry in this LEGO® MINDSTORMS® NXT …
Students experience data collection, analysis and inquiry in this LEGO® MINDSTORMS® NXT -based activity. They measure the position of an oscillating platform using a ultrasonic sensor and perform statistical analysis to determine the mean, mode, median, percent difference and percent error for the collected data.
This applet allows the user to select the number and height of …
This applet allows the user to select the number and height of plants or to name a different item data have been collected about to experiment with to find the total height, mean, median, mode, range, variance, and deviation.
No restrictions on your remixing, redistributing, or making derivative works. Give credit to the author, as required.
Your remixing, redistributing, or making derivatives works comes with some restrictions, including how it is shared.
Your redistributing comes with some restrictions. Do not remix or make derivative works.
Most restrictive license type. Prohibits most uses, sharing, and any changes.
Copyrighted materials, available under Fair Use and the TEACH Act for US-based educators, or other custom arrangements. Go to the resource provider to see their individual restrictions.