In this NASA video, scientists describe how the Extreme Ultraviolet Variability Experiment …
In this NASA video, scientists describe how the Extreme Ultraviolet Variability Experiment will sample and track the Sun's ultraviolet irradiance, providing a detailed time sequence of extreme ultraviolet output -- data that can provide advance warning for potentially disruptive energy bursts.
This video on phenology of plants and bees discusses the MODIS satellite …
This video on phenology of plants and bees discusses the MODIS satellite finding that springtime greening is happening one half-day earlier each year and correlates this to bee pollination field studies.
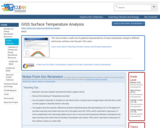
This color-coded map displays a progression of changing five-year average global surface …
This color-coded map displays a progression of changing five-year average global surface temperatures anomalies from 1880 through 2010. The final frame represents global temperature anomalies averaged from 2006 to 2010. The temperature anomalies are computed relative to the base period 1951-1980.
This NASA animation of the Five-Year Average Global Temperature Anomalies from 1881 …
This NASA animation of the Five-Year Average Global Temperature Anomalies from 1881 to 2009 shows how temperature anomalies have varied in the last 130 years. The color-coded map displays a long-term progression of changing global surface temperatures from 1881 to 2009. Dark red indicates the greatest warming and dark blue indicates the greatest cooling.
This video from NASA describes the GLAST satellite, which is equipped with …
This video from NASA describes the GLAST satellite, which is equipped with a gamma-ray telescope, and shares some background about the kinds of extreme universal phenomena indicated by the presence of gamma rays.
With this simulation from the NASA Climate website, learners explore different examples …
With this simulation from the NASA Climate website, learners explore different examples of how ice is melting due to climate change in four places where large quantities of ice are found. The photo comparisons, graphs, animations, and especially the time lapse video clips of glaciers receding are astonishing and dramatic.
In this video segment adapted from United Tribes Technical College, meet Native …
In this video segment adapted from United Tribes Technical College, meet Native Americans who are concerned about climate change and believe that action today can help future generations once again live in harmony with Earth.
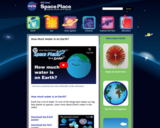
This website has a video, reading passage, and a poster on how …
This website has a video, reading passage, and a poster on how much water is on Earth to help younger students learn that there is a lot of water on Earth and that water is in various places in the world. This resource is from NASA Science.
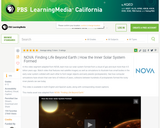
In this video segment adapted from NOVA, explore the theory that small …
In this video segment adapted from NOVA, explore the theory that small bits of gas and dust combined to form protoplanets billions of years ago, which in turn collided to create the four rocky planets of the inner solar system.
In this activity, students examine the effects of hurricanes on sea surface …
In this activity, students examine the effects of hurricanes on sea surface temperature using NASA data. They examine authentic sea surface temperature data to explore how hurricanes extract heat energy from the ocean surface.
This collection of photos from the NASA Climate website features images of …
This collection of photos from the NASA Climate website features images of global change, such as floods, wildfires, and retreating glaciers. Not all images show change caused directly by climate change and energy use, and descriptive captions indicate causes for change in most of the images.
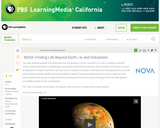
In this video segment adapted from NOVA, a scientist explains the unexpected …
In this video segment adapted from NOVA, a scientist explains the unexpected heat source fueling widespread volcanic activity on Io, a moon of Jupiter that many had previously assumed to be frozen.
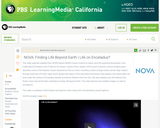
In this video segment adapted from NOVA, scientists are startled to discover …
In this video segment adapted from NOVA, scientists are startled to discover evidence for the three key ingredients for life on Saturn's moon Enceladus.
In this activity students use NASA satellite data to study changes in …
In this activity students use NASA satellite data to study changes in temperature and snow-ice coverage in the South Beaufort Sea, Alaska. They will then correlate the data with USGS ground tracking of polar bears and relate their findings to global change, sea ice changes, and polar bear migration and survival.
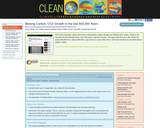
This NASA animation shows the levels of atmospheric carbon dioxide over different …
This NASA animation shows the levels of atmospheric carbon dioxide over different time scales. Viewers can compare the last 400,000 years, last 1000 years, and last 25 years. The data come from the Lake Vostok ice cores (400,000 BC to about 4000 BC), Law Dome ice cores (1010 AD to 1975 AD) and Mauna Loa observations (1980 to 2005).
America's geoheritage arises from the features, landforms, and landscapes characteristic of the …
America's geoheritage arises from the features, landforms, and landscapes characteristic of the United States. These locations are valued for many reasons, including significant scientific, educational, cultural, aesthetic, and recreational purposes. They are conserved so that their lessons and beauty will remain as a legacy for future generations.*
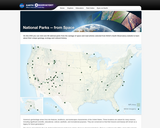
The places stewarded by the U.S. National Park Service hold many stories about our shared geoheritage. There is a national park within a day's drive of most communities in the U.S. where you can connect in person with the land and stories that shaped the character of our nation. You can also experience these parks in another way - from space.
On this DVD you can visit over 60 national parks from the vantage point of space and read articles selected from NASA's Earth Observatory website describing how satellite observations can help people better understand our geoheritage. Space-based views provide useful information on natural processes and human impacts affecting the Earth's surface within and outside of protected areas. For example, landscape changes caused by shifting vegetation types (Great Smoky Mountains), rainfall (Death Valley), glacial retreat (Glacier Bay), fire (Tallgrass Prairie) and climate change can all be observed from space.
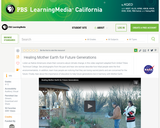
In this video segment adapted from Haskell Indian Nations University, student filmmakers …
In this video segment adapted from Haskell Indian Nations University, student filmmakers explain why it is important to them to make a video about climate change.
No restrictions on your remixing, redistributing, or making derivative works. Give credit to the author, as required.
Your remixing, redistributing, or making derivatives works comes with some restrictions, including how it is shared.
Your redistributing comes with some restrictions. Do not remix or make derivative works.
Most restrictive license type. Prohibits most uses, sharing, and any changes.
Copyrighted materials, available under Fair Use and the TEACH Act for US-based educators, or other custom arrangements. Go to the resource provider to see their individual restrictions.