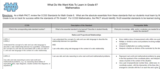
This Essential Learning document highlights those Common Core Standards identified for sixth …
This Essential Learning document highlights those Common Core Standards identified for sixth grade as the priority standards for the year. It also documents the necessary prerequisite skills for each of the identified Essential Standards, when it will be taught within the IM curriculum and how it will be assessed.
Using the story "The Celebrated Jumping Frog of Calaveras County" by Mark …
Using the story "The Celebrated Jumping Frog of Calaveras County" by Mark Twain, learners simulate a jumping-frog contest and determine the distances "jumped." Learners record the distance of individual jumps in centimeters and determine the total distance jumped (the sum of the three separate jumps) and the official distance (the straight-line distance from the starting line to the end of the frog's third jump). Learners compare the range and median of the total distances with those of the official distances of the group.
Students will simulate a jumping frog contest and collect data for frog …
Students will simulate a jumping frog contest and collect data for frog distances jumped. Students will measure three consecutive jumps along with the total distance jumped in centimeters. Students will determine the range of classroom data jumps and find the mean and the median of jump data.
Students will organize and analyze data to make decisions about which rides …
Students will organize and analyze data to make decisions about which rides to choose on their vacation to Disneyland. The students will be given average wait times for a variety of rides at an amusement park and then analyze the data.
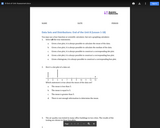
This End of Unit Assessment is used in conjunction with the Illustrative …
This End of Unit Assessment is used in conjunction with the Illustrative Mathematics Curriculum.There is an included of multiple choice and open ended questions. This aligns to the rubric also included at the end of the assessment. This End of Unit Assessment Rubric is used in conjunction with the Illustrative Mathematics Curriculum. It breaks down each question by identifying the Essential Standard associated and then defining what an Advanced, Proficient, Basic or Below Basic student response would entail. This rubric can then be utilized for students to track progress towards proficiency on each of the grade level standards.
This lesson plan combines physical activity (jumping jacks) with data collection. The …
This lesson plan combines physical activity (jumping jacks) with data collection. The purpose of this activity is to compare and contrast the use of mean, median, and mode as the best measure of central tendency. The lesson plan includes three worksheets, extension questions, and assessment options.
In this math activity, learners prepare jumping jack data to send to …
In this math activity, learners prepare jumping jack data to send to officials on the planet Jumpalot. Learners record how many jumping jacks they can do in ten seconds and use their knowledge of time conversions to figure out how many jumping jacks they could complete in a minute all the way to a year. Learners then organize group data and explore mean, median, and mode and the effects extreme values have on these measures. Finally, learners brainstorm the advantages and disadvantages each measure offers. This lesson guide includes questions for learners, assessment options, extensions, and reflection questions.
This Lesson Plan goes over how to find the Mean, Median, Mode, …
This Lesson Plan goes over how to find the Mean, Median, Mode, IQR, and Mean Absolute Deviation of a data set. We will go over some generic examples in the lesson and then do some practical application, as we find each of these from the samples taken to ensure consistent weight of the paper from BPM.
Manufacturers often need to calculate a measure of center to find a …
Manufacturers often need to calculate a measure of center to find a value that best represents the amount of production of their manufactured products. This value assists manufacturers in creating a production standard for the materials they are producing. A production standard is a benchmark used for measuring the production of the company. The unit of measurement used in a production standard indicates the normal level of performance for an industrial operation and is expressed as units per hour or units per day.
Companies use the Mean Absolute Deviation to assist in calculating an accurate measure of center with upper and lower thresholds. These thresholds allow manufacturers to consider modern production variations. By using MAD to calculate the thresholds, manufacturers offer a method to take the causes of different fluctuations in their hourly or daily production standards into account. This video and lesson show how companies calculate production standards and how they use measures of center and variation to create those standards.
No restrictions on your remixing, redistributing, or making derivative works. Give credit to the author, as required.
Your remixing, redistributing, or making derivatives works comes with some restrictions, including how it is shared.
Your redistributing comes with some restrictions. Do not remix or make derivative works.
Most restrictive license type. Prohibits most uses, sharing, and any changes.
Copyrighted materials, available under Fair Use and the TEACH Act for US-based educators, or other custom arrangements. Go to the resource provider to see their individual restrictions.