In this math lesson, learners use yarn to measure lengths such as …
In this math lesson, learners use yarn to measure lengths such as arm span and height. This gives learners practice measuring with nonstandard units. Pairs of learners also compare their height and arm spans. They practice problem-solving and reasoning skills by discussing why there are similarities and differences between the lengths of yarn that represent arm spans and height. This lesson guide includes questions for learners, assessment options, extensions, and reflection questions.
In this group task students collect data and analyze from the class …
In this group task students collect data and analyze from the class to answer the question "is there an association between whether a student plays a sport and whether he or she plays a musical instrument? "
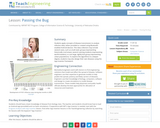
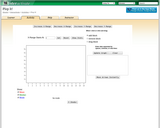
This activity is a physics lab in which students generate distance vs. …
This activity is a physics lab in which students generate distance vs. time graphs for skateboarders of different masses being pulled with various values of constant force. Students develop procedures, record and graph data, and analyze the data in light of Newton's 2nd law.
In this Illuminations unit (three lessons), students formulate and refine questions that …
In this Illuminations unit (three lessons), students formulate and refine questions that can be addressed by categorical data (Lesson 1) and numerical data (Lesson 2). They then collect, organize, and display with bar and circle graphs relevant data to answer those questions. They recognize the differences in analyzing categorical and numerical data. In the final lesson students identify examples of each type of data by looking at the question asked and discover the type of data collected determines the type of data display that is the most appropriate way of representing it. Students work with partners to collect data and create graphs for both types of data using the Data Grapher (cataloged separately).
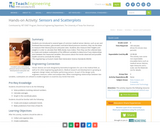
Students apply concepts of disease transmission to analyze infection data, either provided …
Students apply concepts of disease transmission to analyze infection data, either provided or created using Bluetooth-enabled Android devices. This data collection may include several cases, such as small static groups (representing historically rural areas), several roaming students (representing world-travelers), or one large, tightly knit group (representing urban populations). To explore the algorithms to a deeper degree, students may also design their own diseases using the App Inventor framework.
In this lesson plan, students are asked to use measurement skills to …
In this lesson plan, students are asked to use measurement skills to perform an experiment. The data from the experiment is then recorded in a table and analyzed to determine the median and range. The lesson plan includes a PDF document for data collection and analysis, as well as extension suggestions for higher level thinkers.
In this data collection and analysis activity students investigate the data in …
In this data collection and analysis activity students investigate the data in connection with recyclable materials and develop plans to help the environment. Through this activity, students explore recycling plastic containers and graph the frequency of different types of recyclable plastics. The lesson includes student worksheets, extension suggestions, and student questions.
PlopIt allows users to build dot plots of data using the mouse. …
PlopIt allows users to build dot plots of data using the mouse. View how the mean, median, and mode change as entries are added to the plot. Parameters: Range for observations.
In this math meets physics game, learners pretend they are pilots of …
In this math meets physics game, learners pretend they are pilots of rescue helicopters and must fly their helicopters to the top of a mountain to rescue lost hikers. Learners first explore the four forces of flight: lift, drag, thrust, and weight. Before playing the game, learners conduct a probability experiment with spinners and record their results in tally tables and bar graphs. They then use their findings to select spinners with the greatest probability of helping them win the game. In a portion of the game, learners use ordered pairs to plot points on the coordinate plane to show their flight path.
This lesson explores the increase in energy use and cost due to …
This lesson explores the increase in energy use and cost due to a building expansion for an additional 150 students. The lesson was created by David Luety. It is developed for use with Sketchbox, a free building energy modeling tool that runs from a web interface and does not require a download.
Add different salts to water, then watch them dissolve and achieve a …
Add different salts to water, then watch them dissolve and achieve a dynamic equilibrium with solid precipitate. Compare the number of ions in solution for highly soluble NaCl to other slightly soluble salts. Relate the charges on ions to the number of ions in the formula of a salt. Calculate Ksp values.
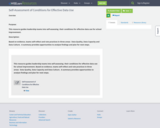
Purpose:This resource guides leadership teams into self-assessing their conditions for effective data …
Purpose:This resource guides leadership teams into self-assessing their conditions for effective data use for school improvement.Description:Based on evidence, teams self-reflect and rate practices in three areas: Data Quality, Data Capacity and Data Culture. A summary provides opportunities to analyze findings and plan for next steps.
Students are introduced to several types of common medical sensor devices, such …
Students are introduced to several types of common medical sensor devices, such as ear and forehead thermometers, glucometers and wrist blood pressure monitors; they use the latter to measure their blood pressure and pulse rates. Students also measure their heights and weights in order to calculate their BMIs (body mass index). Then they use the collected data to create and analyze scatterplots of the different variables to determine if any relationships exist between the measured variables. Discussions about the trends observed and possible health concerns conclude the activity.
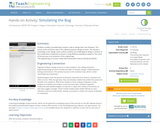
Students modify a provided App Inventor code to design their own diseases. …
Students modify a provided App Inventor code to design their own diseases. This serves as the evolution step in the software/systems design process. The activity is essentially a mini design cycle in which students are challenged to design a solution to the modification, implement and test it using different population patterns The result of this process is an evolution of the original app.
This lesson introduces Sketchbox™, a free energy modeling tool that calculates energy …
This lesson introduces Sketchbox™, a free energy modeling tool that calculates energy use in buildings. Sketchbox™ can run online from a Chromebook with no downloads needed. This activity is for those teaching in math, science, construction, HVAC, sustainability, or computer science. Online tutorials are available, and the platform is ideal for student exploration of building science and various careers ranging from architecture to engineering. Sketchbox was created by Slipstream—a nonprofit organization based in Madison, WI, and curriculum is from the Center for Renewable Energy Advanced Technological Education (CREATE).
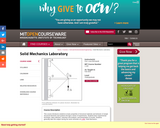
Introduces students to basic properties of structural materials and behavior of simple …
Introduces students to basic properties of structural materials and behavior of simple structural elements and systems through a series of experiments. Students learn experimental technique, data collection, reduction and analysis, and presentation of results.
In this lesson plan students use various types of visual representation to …
In this lesson plan students use various types of visual representation to compare data about the number of letters in the name of each state; students create bar graphs from which they find the Mean, Median, Mode, and Range of their data set (10 states only). These data landmarks and visual representations are used to compare their data with their classmates. The lesson plan includes a grid paper document for creating the bar graph and a link to an applet for a State Data Map (cataloged separately).
Information can be represented in many ways; this applet allows the user …
Information can be represented in many ways; this applet allows the user to represent data about the states using color. The state with the highest data value is darkest; other states are shaded proportionally. Several sets of data are already entered and available for examination: state population, land area, representatives in Congress, gasoline usage, and more. Users can eliminate the data from any state in order to note the consequences, or enter their own data. A box plot and table accompany each map representation, showing the data in different but corresponding formats.
In this data analysis lesson students explore various representations, including bar graphs, …
In this data analysis lesson students explore various representations, including bar graphs, steam-and-leaf plots, and box-and-whisker plots, to analyze the frequency of letters in the names of the 50 states. Students are encouraged to use a systematic approach to collect their data and are shown various tools to help them gather and display it. The lesson includes a student worksheet (PDF), links to a Decrypting Text website, Bar Grapher tool, and Box Plotter tool, and suggested questions, extension, and assessment ideas.
No restrictions on your remixing, redistributing, or making derivative works. Give credit to the author, as required.
Your remixing, redistributing, or making derivatives works comes with some restrictions, including how it is shared.
Your redistributing comes with some restrictions. Do not remix or make derivative works.
Most restrictive license type. Prohibits most uses, sharing, and any changes.
Copyrighted materials, available under Fair Use and the TEACH Act for US-based educators, or other custom arrangements. Go to the resource provider to see their individual restrictions.