This unit focuses on measurement and data for second grade. The second-graders …
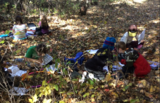
This unit focuses on measurement and data for second grade. The second-graders learn how toaccurately measure natural objects using nonstandard units (unifix cubes) and standard units(inches). During field experiences, the students learned how to use field guides and how to collectdata for a BioBlitz. Students used their data to create bar graphs, picture graphs and analyzed theirdata.
In this 5-lesson unit primary students identify attributes of buttons and other …
In this 5-lesson unit primary students identify attributes of buttons and other objects in their classrooms. Throughout the unit students learn to collect data about objects, display the data (Venn diagrams, pictographs, and bar graphs), and analyze the data to determine what this tells us about buttons and/or other objects. Each of the five lesson plans includes necessary student/class worksheets, questions for students, extension ideas, and assessment ideas. Lessons 2 and 3 reference stories that are an important part of the skill development: "The Button Box" by Margarette Reid and "The Elves and the Shoemaker" story.
In this lesson students use a rule of thumb about the weight …
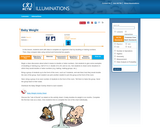
In this lesson students use a rule of thumb about the weight of babies to practice doubling and halving numbers. They complete an organized table and compare data using vertical and horizontal double bar graphs. The lesson includes a student activity sheet and extension ideas.
In this lesson plan students conduct a survey of ten students, collect …
In this lesson plan students conduct a survey of ten students, collect data in a tally chart, and then display and analyze the results in a bar graph. In the analysis students must compare numbers, add, and subtract using the data in the bar graph to generate questions as well as answer them. The lesson plan includes a graph template, a link to an interactive graphing tool, extension questions, and a fact family sheet to show the related facts from their graph analysis.
In this 8-lesson unit students use buttons to explore logical and numerical …
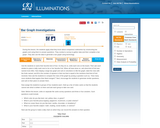
In this 8-lesson unit students use buttons to explore logical and numerical relationships that form the conceptual basis for understanding addition and subtraction operations. Topics include counting, ordinal numbers (and relative position), classification (attributes), relationships between numbers, addition of sets, commutativity of addition, sums to 10, fact families (including subtraction), three models of subtraction ("take away", comparative, missing addend), and bar graphs. Includes student activity sheets and a link to an online graphing applet.
In this 8-lesson unit students use buttons to explore logical and numerical …
In this 8-lesson unit students use buttons to explore logical and numerical relationships that form the conceptual basis for understanding addition and subtraction operations. Topics include counting, ordinal numbers (and relative position), classification (attributes), relationships between numbers, addition of sets, commutativity of addition, sums to 10, fact families (including subtraction), three models of subtraction ("take away", comparative, missing addend), and bar graphs. Includes student activity sheets and a link to an online graphing applet.
In this lesson plan students learn to create bar graphs using unifix …
In this lesson plan students learn to create bar graphs using unifix cubes, translate this representation to graph paper, and then compare the data that has been collected and displayed. Students are encouraged to make up their own questions about the data (favorite juice) and to practice with multiple sets of data. Sample questions for students and extension ideas are included. The lesson contains links to a PDF of graph paper and the Bar Grapher tool which is cataloged separately in this database.
This unit contains two lessons which help students develop number sense through …
This unit contains two lessons which help students develop number sense through activities involving collection, representation, and analysis of data. Students also practice reading and writing large numbers and develop estimation skills. In Lesson 1, Every Breath You Take, students estimate the number of breaths taken during a specified time, experiment, and display real-life data. In Lesson 2, Making Your First Millions, students develop the concept of a million by working with smaller numerical units, such as blocks of 10 or 100, and then expanding the idea by multiplication or repeated addition. They analyze situations and identify patterns that will enable them to develop the concept of large numbers. Each lesson includes student activity sheets, an instructional plan, and extensions.
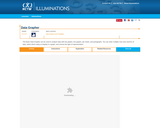
Students use this interactive tool to explore the connections between data sets …
Students use this interactive tool to explore the connections between data sets and their representations in charts and graphs. Enter data in a table (1 to 6 columns, unlimited rows), and preview or print bar graphs, line graphs, pie charts, and pictographs. Students can select which set(s) of data to display in each graph, and compare the effects of different representations of the same data. Instructions and exploration questions are provided using the expandable "+" signs above the tool.
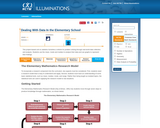
This project-based unit on statistics provides an opportunity for problem solving through …
This project-based unit on statistics provides an opportunity for problem solving through real-world data collection and analysis. Students follow the seven- step "Elementary Mathematics Research Model" by identifying a research question, predicting the answer, and conducting research to test their hypothesis. Students use the mean, mode and median to analyze their data and use graphs to represent their findings so they can draw and justify conclusions. The lesson plan includes examples, questions for students, and possible assessment and extension ideas.
In this 7- lesson unit students use tallies, pictographs, bar graphs, line …
In this 7- lesson unit students use tallies, pictographs, bar graphs, line plots, circle graphs, box-and-whisker plots, and glyphs to collect and display data about healthy eating. The unit includes lessons in which two sets of data are being compared and data sets are being analyzed for measures of central tendency (mean, median, mode). Learning objectives, materials, student questions, extensions, teacher reflections, and links to create graphs virtually are included.
In this unit, students use online pan balances to study equality, order …
In this unit, students use online pan balances to study equality, order of operations, numerical and variable expressions, and other key algebraic concepts. Lessons focus on balancing shapes to study equality and equivalence; balancing algebraic understanding, to explore simplifying expressions; and balancing algebra, to determine if algebraic expressions are equal.
This unit of four lessons from NCTM's Illuminations lets students conduct surveys …
This unit of four lessons from NCTM's Illuminations lets students conduct surveys and represent data in a variety of ways. They also find and compare measures of center. The lessons center around a food court, where students create and use menus in a meaningful way. Topics covered include bar graphs, line plots, and pictographs, measures of center, and probability of events. Individual lessons link to related tools where appropriate, and include questions for students, assessment options, and teacher reflection questions.
In this lesson plan students gather data about the items that they …
In this lesson plan students gather data about the items that they would normally throw in the trash. Once students collect the data they create a bar graph to display the number and kinds of materials they discard and then use this data to create a plan to reduce garbage and help the environment. The lesson plan includes an activity sheet (PDF) for graphing data and extension activity suggestions.
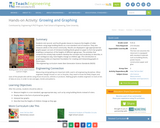
Students visit second- and fourth-grade classes to measure the heights of older …
Students visit second- and fourth-grade classes to measure the heights of older students using large building blocks as a non-standard unit of measure. They also measure adults in the school community. Results are displayed in age-appropriate bar graphs (paper cut-outs of miniature building blocks glued on paper to form bar graphs) enabling a comparison of the heights of different age groups. The activities that comprise this activity help students develop the concepts and vocabulary to describe, in a non-ambiguous way, how heights change as children age. This introduction to graphing provides an important foundation for creating and interpreting graphs in future years.
In this lesson activity students use nonstandard units (baby steps) to measure …
In this lesson activity students use nonstandard units (baby steps) to measure lengths of different types of "steps" (giant, regular, umbrella, scissor, wooden-soldier, and backwards steps). Once each student gathers this data they will display their own data on a bar graph. Then the class will discuss the data and compare graphs among students. A students worksheet for data collection is included in PDF format.
In this recycling activity students conduct a poll and display data showing …
In this recycling activity students conduct a poll and display data showing which type of material the survey population feels is the best for shopping bags. Students share their results in a data display of their choice and then use the data to draw conclusions and create a recycling plan. The activity includes the student worksheet, extension suggestions, and related resources.
Students plant sunflower seeds in plastic cups, and once germinated, expose them …
Students plant sunflower seeds in plastic cups, and once germinated, expose them to varying light or soil moisture conditions. They measure growth of the seedlings every few days using non-standard measurement (inch cubes). After a few weeks, they compare the growth of plants exposed to the different conditions and make bar comparative graphs, which they analyze to draw conclusions about the needs of plants.
No restrictions on your remixing, redistributing, or making derivative works. Give credit to the author, as required.
Your remixing, redistributing, or making derivatives works comes with some restrictions, including how it is shared.
Your redistributing comes with some restrictions. Do not remix or make derivative works.
Most restrictive license type. Prohibits most uses, sharing, and any changes.
Copyrighted materials, available under Fair Use and the TEACH Act for US-based educators, or other custom arrangements. Go to the resource provider to see their individual restrictions.