Students use Google Docs to create an illustrative table. This stand alone …
Students use Google Docs to create an illustrative table. This stand alone or extention exercise begins with student reflection and goal-setting using the popular venacular, "bucket list." This lesson assumes prior knowledge or instruction in table creation in Google Docs.
Learn about graphing polynomials. The shape of the curve changes as the …
Learn about graphing polynomials. The shape of the curve changes as the constants are adjusted. View the curves for the individual terms (e.g. y=bx ) to see how they add to generate the polynomial curve.
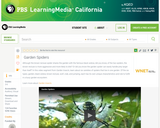
Build a gene network! The lac operon is a set of genes …
Build a gene network! The lac operon is a set of genes which are responsible for the metabolism of lactose in some bacterial cells. Explore the effects of mutations within the lac operon by adding or removing genes from the DNA.
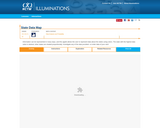
Information can be represented in many ways; this applet allows the user …
Information can be represented in many ways; this applet allows the user to represent data about the states using color. The state with the highest data value is darkest; other states are shaded proportionally. Several sets of data are already entered and available for examination: state population, land area, representatives in Congress, gasoline usage, and more. Users can eliminate the data from any state in order to note the consequences, or enter their own data. A box plot and table accompany each map representation, showing the data in different but corresponding formats.
No restrictions on your remixing, redistributing, or making derivative works. Give credit to the author, as required.
Your remixing, redistributing, or making derivatives works comes with some restrictions, including how it is shared.
Your redistributing comes with some restrictions. Do not remix or make derivative works.
Most restrictive license type. Prohibits most uses, sharing, and any changes.
Copyrighted materials, available under Fair Use and the TEACH Act for US-based educators, or other custom arrangements. Go to the resource provider to see their individual restrictions.