In this lesson plan, students are asked to use measurement skills to …
In this lesson plan, students are asked to use measurement skills to perform an experiment. The data from the experiment is then recorded in a table and analyzed to determine the median and range. The lesson plan includes a PDF document for data collection and analysis, as well as extension suggestions for higher level thinkers.
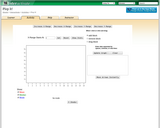
PlopIt allows users to build dot plots of data using the mouse. …
PlopIt allows users to build dot plots of data using the mouse. View how the mean, median, and mode change as entries are added to the plot. Parameters: Range for observations.
In this lesson plan students use various types of visual representation to …
In this lesson plan students use various types of visual representation to compare data about the number of letters in the name of each state; students create bar graphs from which they find the Mean, Median, Mode, and Range of their data set (10 states only). These data landmarks and visual representations are used to compare their data with their classmates. The lesson plan includes a grid paper document for creating the bar graph and a link to an applet for a State Data Map (cataloged separately).
Information can be represented in many ways; this applet allows the user …
Information can be represented in many ways; this applet allows the user to represent data about the states using color. The state with the highest data value is darkest; other states are shaded proportionally. Several sets of data are already entered and available for examination: state population, land area, representatives in Congress, gasoline usage, and more. Users can eliminate the data from any state in order to note the consequences, or enter their own data. A box plot and table accompany each map representation, showing the data in different but corresponding formats.
In this data analysis lesson students explore various representations, including bar graphs, …
In this data analysis lesson students explore various representations, including bar graphs, steam-and-leaf plots, and box-and-whisker plots, to analyze the frequency of letters in the names of the 50 states. Students are encouraged to use a systematic approach to collect their data and are shown various tools to help them gather and display it. The lesson includes a student worksheet (PDF), links to a Decrypting Text website, Bar Grapher tool, and Box Plotter tool, and suggested questions, extension, and assessment ideas.
In this lesson plan students create graphs and analyze data based on …
In this lesson plan students create graphs and analyze data based on the data provided by the United States Census Bureau. Students choose five states to focus on and create a bar graph for each, then students compare the data represented in the graphs and answer questions about the data. The lesson includes student activity sheet, the link to the U.S. Census Bureau is no longer active, please follow this link instead: http://www.census.gov/population/projections/files/stateproj/stpjpop.txt
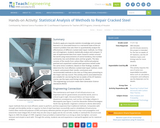
Students apply pre-requisite statistics knowledge and concepts learned in an associated lesson …
Students apply pre-requisite statistics knowledge and concepts learned in an associated lesson to a real-world state-of-the-art research problem that asks them to quantitatively analyze the effectiveness of different cracked steel repair methods. As if they are civil engineers, students statistically analyze and compare 12 sets of experimental data from seven research centers around the world using measurements of central tendency, five-number summaries, box-and-whisker plots and bar graphs. The data consists of the results from carbon-fiber-reinforced polymer patched and unpatched cracked steel specimens tested under the same stress conditions. Based on their findings, students determine the most effective cracked steel repair method, create a report, and present their results, conclusions and recommended methods to the class as if they were presenting to the mayor and city council. This activity and its associated lesson are suitable for use during the last six weeks of the AP Statistics course; see the topics and timing note for details.
This Lesson Plan goes over how to find the Mean, Median, Mode, …
This Lesson Plan goes over how to find the Mean, Median, Mode, IQR, and Mean Absolute Deviation of a data set. We will go over some generic examples in the lesson and then do some practical application, as we find each of these from the samples taken to ensure consistent weight of the paper from BPM.
This activity displays a stem and leaf plot representing data either entered …
This activity displays a stem and leaf plot representing data either entered by the user or generated by the computer. The user can use the applet as a tool that creates a stem and leaf plot from data the user inputs, or to practice calculating the mean, median, and mode of a given data set.
In this unit of five lessons from NCTM's Illuminations, students explore the …
In this unit of five lessons from NCTM's Illuminations, students explore the numbers of letters in their names and create bar graphs, pictographs, circle graphs, and glyphs. They also find the range, compute measures of center, and create box-and-whisker plots. Individual lessons link to related tools where appropriate, and include questions for students, assessment options, teacher reflection questions, and sometimes extensions.
(Nota: Esta es una traducción de un recurso educativo abierto creado por …
(Nota: Esta es una traducción de un recurso educativo abierto creado por el Departamento de Educación del Estado de Nueva York (NYSED) como parte del proyecto "EngageNY" en 2013. Aunque el recurso real fue traducido por personas, la siguiente descripción se tradujo del inglés original usando Google Translate para ayudar a los usuarios potenciales a decidir si se adapta a sus necesidades y puede contener errores gramaticales o lingüísticos. La descripción original en inglés también se proporciona a continuación.)
En este módulo, los estudiantes reconectan y profundizan su comprensión de las estadísticas y los conceptos de probabilidad introducidos por primera vez en los grados 6, 7 y 8. Los estudiantes desarrollan un conjunto de herramientas para comprender e interpretar la variabilidad en los datos, y comienzan a tomar decisiones más informadas de los datos . Trabajan con distribuciones de datos de varias formas, centros y diferenciales. Los estudiantes se basan en su experiencia con datos cuantitativos bivariados del grado 8. Este módulo prepara el escenario para un trabajo más extenso con muestreo e inferencia en calificaciones posteriores.
Encuentre el resto de los recursos matemáticos de Engageny en https://archive.org/details/engageny-mathematics.
English Description: In this module, students reconnect with and deepen their understanding of statistics and probability concepts first introduced in Grades 6, 7, and 8. Students develop a set of tools for understanding and interpreting variability in data, and begin to make more informed decisions from data. They work with data distributions of various shapes, centers, and spreads. Students build on their experience with bivariate quantitative data from Grade 8. This module sets the stage for more extensive work with sampling and inference in later grades.
Find the rest of the EngageNY Mathematics resources at https://archive.org/details/engageny-mathematics.
No restrictions on your remixing, redistributing, or making derivative works. Give credit to the author, as required.
Your remixing, redistributing, or making derivatives works comes with some restrictions, including how it is shared.
Your redistributing comes with some restrictions. Do not remix or make derivative works.
Most restrictive license type. Prohibits most uses, sharing, and any changes.
Copyrighted materials, available under Fair Use and the TEACH Act for US-based educators, or other custom arrangements. Go to the resource provider to see their individual restrictions.