This is a task from the Illustrative Mathematics website that is one …
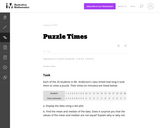
This is a task from the Illustrative Mathematics website that is one part of a complete illustration of the standard to which it is aligned. Each task has at least one solution and some commentary that addresses important asects of the task and its potential use. Here are the first few lines of the commentary for this task: Each of the 20 students in Mr. Anderson's class timed how long it took them to solve a puzzle. Their times (in minutes) are listed below: Student123456...
This is a task from the Illustrative Mathematics website that is one …
This is a task from the Illustrative Mathematics website that is one part of a complete illustration of the standard to which it is aligned. Each task has at least one solution and some commentary that addresses important aspects of the task and its potential use.
In this math activity, learners are challenged to create aluminum foil boats …
In this math activity, learners are challenged to create aluminum foil boats that will hold plastic bears until the boats sink. The lesson serves as a fun, hands-on way to collect data. Data from two attempts is collected and used to make two class box-and-whisker plots with some surprising results. This lesson guide includes questions for learners, assessment options, extensions, and reflection questions.
Using the story "The Celebrated Jumping Frog of Calaveras County" by Mark …
Using the story "The Celebrated Jumping Frog of Calaveras County" by Mark Twain, learners simulate a jumping-frog contest and determine the distances "jumped." Learners record the distance of individual jumps in centimeters and determine the total distance jumped (the sum of the three separate jumps) and the official distance (the straight-line distance from the starting line to the end of the frog's third jump). Learners compare the range and median of the total distances with those of the official distances of the group.
Students will simulate a jumping frog contest and collect data for frog …
Students will simulate a jumping frog contest and collect data for frog distances jumped. Students will measure three consecutive jumps along with the total distance jumped in centimeters. Students will determine the range of classroom data jumps and find the mean and the median of jump data.
In this math activity, learners prepare jumping jack data to send to …
In this math activity, learners prepare jumping jack data to send to officials on the planet Jumpalot. Learners record how many jumping jacks they can do in ten seconds and use their knowledge of time conversions to figure out how many jumping jacks they could complete in a minute all the way to a year. Learners then organize group data and explore mean, median, and mode and the effects extreme values have on these measures. Finally, learners brainstorm the advantages and disadvantages each measure offers. This lesson guide includes questions for learners, assessment options, extensions, and reflection questions.
In this math meets engineering activity, learners make paper airplanes and explore …
In this math meets engineering activity, learners make paper airplanes and explore attributes related to increasing flight distances. Each learner collects data from three flights of the airplane and finds the median distance. Learners then collect, organize, display, and interpret the median distances for the group in a stem-and-leaf plot. This lesson guide includes questions for learners, assessment options, extensions, and reflection questions.
In this math meets physics game, learners pretend they are pilots of …
In this math meets physics game, learners pretend they are pilots of rescue helicopters and must fly their helicopters to the top of a mountain to rescue lost hikers. Learners first explore the four forces of flight: lift, drag, thrust, and weight. Before playing the game, learners conduct a probability experiment with spinners and record their results in tally tables and bar graphs. They then use their findings to select spinners with the greatest probability of helping them win the game. In a portion of the game, learners use ordered pairs to plot points on the coordinate plane to show their flight path.
This Lesson Plan goes over how to find the Mean, Median, Mode, …
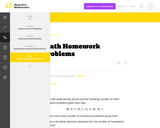
This Lesson Plan goes over how to find the Mean, Median, Mode, IQR, and Mean Absolute Deviation of a data set. We will go over some generic examples in the lesson and then do some practical application, as we find each of these from the samples taken to ensure consistent weight of the paper from BPM.
Manufacturers often need to calculate a measure of center to find a …
Manufacturers often need to calculate a measure of center to find a value that best represents the amount of production of their manufactured products. This value assists manufacturers in creating a production standard for the materials they are producing. A production standard is a benchmark used for measuring the production of the company. The unit of measurement used in a production standard indicates the normal level of performance for an industrial operation and is expressed as units per hour or units per day.
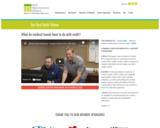
Companies use the Mean Absolute Deviation to assist in calculating an accurate measure of center with upper and lower thresholds. These thresholds allow manufacturers to consider modern production variations. By using MAD to calculate the thresholds, manufacturers offer a method to take the causes of different fluctuations in their hourly or daily production standards into account. This video and lesson show how companies calculate production standards and how they use measures of center and variation to create those standards.
No restrictions on your remixing, redistributing, or making derivative works. Give credit to the author, as required.
Your remixing, redistributing, or making derivatives works comes with some restrictions, including how it is shared.
Your redistributing comes with some restrictions. Do not remix or make derivative works.
Most restrictive license type. Prohibits most uses, sharing, and any changes.
Copyrighted materials, available under Fair Use and the TEACH Act for US-based educators, or other custom arrangements. Go to the resource provider to see their individual restrictions.