In this unit plan students apply their knowledge of data collection, display, …
In this unit plan students apply their knowledge of data collection, display, and analysis to create a plan for improving the environment. Each of the four lessons in this unit requires students to collect data about recyclable materials and display the data for analysis. Each lesson includes students worksheets (PDF), discussion questions, and extension ideas.
This unit focuses on measurement and data for second-grade. The second-graders learn …
This unit focuses on measurement and data for second-grade. The second-graders learn how to accurately measure natural objects using nonstandard units (unifix cubes) and standard units (inches). During field experiences, the students learned how to use field guides and how to collect data for a BioBlitz. Students used their data to create bar graphs, picture graphs, and analyzed their data.
In this Illuminations unit (three lessons), students formulate and refine questions that …
In this Illuminations unit (three lessons), students formulate and refine questions that can be addressed by categorical data (Lesson 1) and numerical data (Lesson 2). They then collect, organize, and display with bar and circle graphs relevant data to answer those questions. They recognize the differences in analyzing categorical and numerical data. In the final lesson students identify examples of each type of data by looking at the question asked and discover the type of data collected determines the type of data display that is the most appropriate way of representing it. Students work with partners to collect data and create graphs for both types of data using the Data Grapher (cataloged separately).
In this three-lesson unit students conduct surveys, create graphs, and explore combinations …
In this three-lesson unit students conduct surveys, create graphs, and explore combinations related to pizza toppings. Each lesson plan contains worksheets in PDF format.
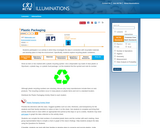
In this data collection and analysis activity students investigate the data in …
In this data collection and analysis activity students investigate the data in connection with recyclable materials and develop plans to help the environment. Through this activity, students explore recycling plastic containers and graph the frequency of different types of recyclable plastics. The lesson includes student worksheets, extension suggestions, and student questions.
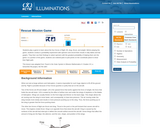
In this math meets physics game, learners pretend they are pilots of …
In this math meets physics game, learners pretend they are pilots of rescue helicopters and must fly their helicopters to the top of a mountain to rescue lost hikers. Learners first explore the four forces of flight: lift, drag, thrust, and weight. Before playing the game, learners conduct a probability experiment with spinners and record their results in tally tables and bar graphs. They then use their findings to select spinners with the greatest probability of helping them win the game. In a portion of the game, learners use ordered pairs to plot points on the coordinate plane to show their flight path.
In this lesson plan students explore the four forces of flight in …
In this lesson plan students explore the four forces of flight in order to complete the "Rescue Mission". Students must use their knowledge of probability to choose the spinner that will help them win the game. Students must also use their knowledge of graphing points on a coordinate grid in order to plot the results of each spin. The game board and spinners are included (PDF).
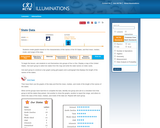
In this lesson plan students use various types of visual representation to …
In this lesson plan students use various types of visual representation to compare data about the number of letters in the name of each state; students create bar graphs from which they find the Mean, Median, Mode, and Range of their data set (10 states only). These data landmarks and visual representations are used to compare their data with their classmates. The lesson plan includes a grid paper document for creating the bar graph and a link to an applet for a State Data Map (cataloged separately).
In this data analysis lesson students explore various representations, including bar graphs, …
In this data analysis lesson students explore various representations, including bar graphs, steam-and-leaf plots, and box-and-whisker plots, to analyze the frequency of letters in the names of the 50 states. Students are encouraged to use a systematic approach to collect their data and are shown various tools to help them gather and display it. The lesson includes a student worksheet (PDF), links to a Decrypting Text website, Bar Grapher tool, and Box Plotter tool, and suggested questions, extension, and assessment ideas.
In this lesson plan students create graphs and analyze data based on …
In this lesson plan students create graphs and analyze data based on the data provided by the United States Census Bureau. Students choose five states to focus on and create a bar graph for each, then students compare the data represented in the graphs and answer questions about the data. The lesson includes student activity sheet, the link to the U.S. Census Bureau is no longer active, please follow this link instead: http://www.census.gov/population/projections/files/stateproj/stpjpop.txt
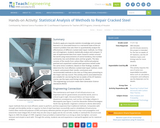
Students apply pre-requisite statistics knowledge and concepts learned in an associated lesson …
Students apply pre-requisite statistics knowledge and concepts learned in an associated lesson to a real-world state-of-the-art research problem that asks them to quantitatively analyze the effectiveness of different cracked steel repair methods. As if they are civil engineers, students statistically analyze and compare 12 sets of experimental data from seven research centers around the world using measurements of central tendency, five-number summaries, box-and-whisker plots and bar graphs. The data consists of the results from carbon-fiber-reinforced polymer patched and unpatched cracked steel specimens tested under the same stress conditions. Based on their findings, students determine the most effective cracked steel repair method, create a report, and present their results, conclusions and recommended methods to the class as if they were presenting to the mayor and city council. This activity and its associated lesson are suitable for use during the last six weeks of the AP Statistics course; see the topics and timing note for details.
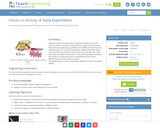
Students conduct an experiment to determine whether or not the sense of …
Students conduct an experiment to determine whether or not the sense of smell is important to being able to recognize foods by taste. They do this by attempting to identify several different foods that have similar textures. For some of the attempts, students hold their noses and close their eyes, while for others they only close their eyes. After they have conducted the experiment, they create bar graphs showing the number of correct and incorrect identifications for the two different experimental conditions tested.
In this statistics lesson plan, students gather information using the Internet about …
In this statistics lesson plan, students gather information using the Internet about party affiliation and age at time of inauguration of current and past Presidents in order to construct a bar graph and a histogram. Once all of the data is collected students work together to complete the appropriate data displays and compare and contrast their findings. The lesson plan includes questions for reflection and discussion, student activity sheet, answer key, and an assessment option activity sheet and answer key.
In this month-long interdisciplinary project students collect weather data, determine the best …
In this month-long interdisciplinary project students collect weather data, determine the best visual representation for displaying it, and discuss the patterns and implications of their findings. This resource includes extension and assessment suggestions and guiding questions.
In this unit of five lessons from NCTM's Illuminations, students explore the …
In this unit of five lessons from NCTM's Illuminations, students explore the numbers of letters in their names and create bar graphs, pictographs, circle graphs, and glyphs. They also find the range, compute measures of center, and create box-and-whisker plots. Individual lessons link to related tools where appropriate, and include questions for students, assessment options, teacher reflection questions, and sometimes extensions.
No restrictions on your remixing, redistributing, or making derivative works. Give credit to the author, as required.
Your remixing, redistributing, or making derivatives works comes with some restrictions, including how it is shared.
Your redistributing comes with some restrictions. Do not remix or make derivative works.
Most restrictive license type. Prohibits most uses, sharing, and any changes.
Copyrighted materials, available under Fair Use and the TEACH Act for US-based educators, or other custom arrangements. Go to the resource provider to see their individual restrictions.