This activity allows the user to practice fractions and get a better …
This activity allows the user to practice fractions and get a better understanding of them. They get a chance to work with two different aspects of fractions: making them and putting them in order from least to greatest.
This applet is an expanded version of 3D Transmographer. This 3-dimensional model …
This applet is an expanded version of 3D Transmographer. This 3-dimensional model allows users to explore functions and their revolution around an axis. Once one or two functions have been rotated around an axis, the applet calculates the surface area and volume for the resulting solid. By clicking and dragging on the graph, users can change the vantage point from which they view the graph in order to better understand the functions, the revolution, and the resulting solid.
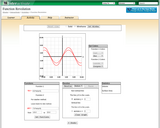
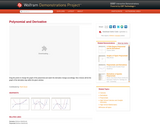
This Demonstration illustrates the connection between a function and its derivative on …
This Demonstration illustrates the connection between a function and its derivative on two separate graphs. The green vertical bars indicate the value of the rate of change at the point of tangency.
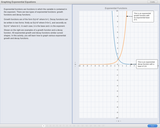
Students graph exponential growth and decay functions by connecting ordered pairs. This …
Students graph exponential growth and decay functions by connecting ordered pairs. This is the first of three activities about Exponential Functions. The associated lesson plan and student assessment questions can be found at: https://concord.org/projects/smartgraphs#curriculum and clicking on “Algebra†and then “Exponential Functions.â€Â
The graph of y = f '(x) will be given. Your goal …
The graph of y = f '(x) will be given. Your goal is to sketch the graph of the derivative: y = f (x). Use your mouse moving from left to right, staying on the graphing board, to draw the curve. When you are ready to sketch the graph move you mouse to the far left and click and drag. Be sure to move your mouse slowly. Moving too quickly will result in the deduction of points.
This Demonstration shows the instantaneous rate of change for different x values …
This Demonstration shows the instantaneous rate of change for different x values for polynomial functions of degree 2, 3, or 4, an exponential function, and a logistic function.
This applet allows the user to investigate the mean, median, and box-and-whisker …
This applet allows the user to investigate the mean, median, and box-and-whisker plot for a set of data that they create. The data set may contain up to 15 integers, each with a value from 0 to 100.
This applet allows the user to select the number and height of …
This applet allows the user to select the number and height of plants or to name a different item data have been collected about to experiment with to find the total height, mean, median, mode, range, variance, and deviation.
Mixtures allows the user to explore percent problems with two sets of …
Mixtures allows the user to explore percent problems with two sets of circles. Each set of circles can have both colored and / or uncolored circles. The number of colored circles represents the percent of each pile. The user can select from a four modes: Exploration, Unknown Pile, Unknown Percent, or Unknown total.
Typically, American mortgage lenders will offer potential borrowers a menu of loans, …
Typically, American mortgage lenders will offer potential borrowers a menu of loans, each of which bears an interest rate and an extra amount of "interest" that the borrower must pay at the inception of the loan. This extra prepaid interest is generally referred to as "points" and is computed as a stated fraction of the initial loan balance. The menu generally permits the borrower to "buy down" the interest rate by paying points. If the borrower thinks he or she will hold the underlying real estate for a long period, it is often a good idea to pay points. On the other hand, if the borrower thinks he or she is likely to sell the underlying real estate in the near future, points are often not a good idea.
In this two-player e-example, students take timed turns racing to the end …
In this two-player e-example, students take timed turns racing to the end of each fraction line by moving one or more of their markers to sum to a given fraction value.
PlopIt allows users to build dot plots of data using the mouse. …
PlopIt allows users to build dot plots of data using the mouse. View how the mean, median, and mode change as entries are added to the plot. Parameters: Range for observations.
Drag the points to change the graph of the polynomial and watch …
Drag the points to change the graph of the polynomial and watch the derivative change accordingly. Nice choices will let the graph of the derivative stay within the given window.
Drag the red marker along the x axis to move the point. …
Drag the red marker along the x axis to move the point. Choose among polynomials of degree 2, 3, 4, or 5. Check the boxes to see the tangent line and the derivative graphs.
This activity displays a stem and leaf plot representing data either entered …
This activity displays a stem and leaf plot representing data either entered by the user or generated by the computer. The user can use the applet as a tool that creates a stem and leaf plot from data the user inputs, or to practice calculating the mean, median, and mode of a given data set.
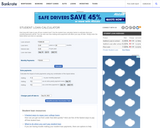
The "Student loan debt calculator" applies two simple principles to paying off …
The "Student loan debt calculator" applies two simple principles to paying off high-interest debt. 1. Consolidate the existing student loans 2. Use the extra cash every month to pay off other higher interest debt sooner. We apply the amount of payment savings you choose to the nonstudent loan debt with the highest rate. When that balance is paid in full, the balance with the next highest rate will be paid down. This continues until you have rolled through all of the balances and the non-student loan debt is paid in full. Click the "View Report" button for a detailed look at the results.
No restrictions on your remixing, redistributing, or making derivative works. Give credit to the author, as required.
Your remixing, redistributing, or making derivatives works comes with some restrictions, including how it is shared.
Your redistributing comes with some restrictions. Do not remix or make derivative works.
Most restrictive license type. Prohibits most uses, sharing, and any changes.
Copyrighted materials, available under Fair Use and the TEACH Act for US-based educators, or other custom arrangements. Go to the resource provider to see their individual restrictions.