Remix this template to upload your ACP lesson and unit plans into WISELearn.

Remix this template to upload your ACP lesson and unit plans into WISELearn.

In this lesson, students will learn how to enter data and formulas into an Excel spreadsheet. They'll also learn how to use the data to create and format graphs and charts.

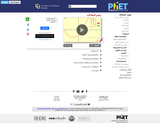
Learn about graphing polynomials. The shape of the curve changes as the constants are adjusted. View the curves for the individual terms (e.g. y=bx ) to see how they add to generate the polynomial curve.

Build a gene network! The lac operon is a set of genes which are responsible for the metabolism of lactose in some bacterial cells. Explore the effects of mutations within the lac operon by adding or removing genes from the DNA.