This Desmos activity provides an interactive opportunity for students to work with …
This Desmos activity provides an interactive opportunity for students to work with data as represented between data and the box plot that results from it. Students walk through an investigation on interpreting center, spread, and the impact of outliers on various box plots. Students will also use their inference skills to compare two box plots. The teacher has the ability to pace students on slides, pause them, and promote whole class discussion based upon individual student responses. The teacher can also anonymize students names to provide for more risk taking in their responses.Students may be reminded of their prior knowledge of a box plot from middle school before starting this lesson.This original lesson was created by Bob Lochel and modified by Emily O'Brien.
This Flash tool allows students to make a box plot of their …
This Flash tool allows students to make a box plot of their data, using up to four categories of their own choosing, or using one of the data sets provided. The tool will plot all the data together, or break it out by category. Students can set a multiple of the Interquartile Range to be the Extreme Range, and exclude that data from the graph if they wish. Associated lessons (free) and a Mathematics Assessment Sampler (for purchase) are linked at the right side of the page.
In this 7- lesson unit students use tallies, pictographs, bar graphs, line …
In this 7- lesson unit students use tallies, pictographs, bar graphs, line plots, circle graphs, box-and-whisker plots, and glyphs to collect and display data about healthy eating. The unit includes lessons in which two sets of data are being compared and data sets are being analyzed for measures of central tendency (mean, median, mode). Learning objectives, materials, student questions, extensions, teacher reflections, and links to create graphs virtually are included.
This unit of four lessons from NCTM's Illuminations lets students conduct surveys …
This unit of four lessons from NCTM's Illuminations lets students conduct surveys and represent data in a variety of ways. They also find and compare measures of center. The lessons center around a food court, where students create and use menus in a meaningful way. Topics covered include bar graphs, line plots, and pictographs, measures of center, and probability of events. Individual lessons link to related tools where appropriate, and include questions for students, assessment options, and teacher reflection questions.
This lesson, from Illuminations, gives students practice in measurement and in displaying …
This lesson, from Illuminations, gives students practice in measurement and in displaying and interpreting data through box-and-whisker plots. Students may draw the plots themselves or use the online Box Plotter tool. Learning objectives, materials, student questions, extensions, teacher reflections, and NCTM Standards alignment are provided.
Information can be represented in many ways; this applet allows the user …
Information can be represented in many ways; this applet allows the user to represent data about the states using color. The state with the highest data value is darkest; other states are shaded proportionally. Several sets of data are already entered and available for examination: state population, land area, representatives in Congress, gasoline usage, and more. Users can eliminate the data from any state in order to note the consequences, or enter their own data. A box plot and table accompany each map representation, showing the data in different but corresponding formats.
In this data analysis lesson students explore various representations, including bar graphs, …
In this data analysis lesson students explore various representations, including bar graphs, steam-and-leaf plots, and box-and-whisker plots, to analyze the frequency of letters in the names of the 50 states. Students are encouraged to use a systematic approach to collect their data and are shown various tools to help them gather and display it. The lesson includes a student worksheet (PDF), links to a Decrypting Text website, Bar Grapher tool, and Box Plotter tool, and suggested questions, extension, and assessment ideas.
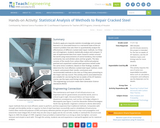
Students apply pre-requisite statistics knowledge and concepts learned in an associated lesson …
Students apply pre-requisite statistics knowledge and concepts learned in an associated lesson to a real-world state-of-the-art research problem that asks them to quantitatively analyze the effectiveness of different cracked steel repair methods. As if they are civil engineers, students statistically analyze and compare 12 sets of experimental data from seven research centers around the world using measurements of central tendency, five-number summaries, box-and-whisker plots and bar graphs. The data consists of the results from carbon-fiber-reinforced polymer patched and unpatched cracked steel specimens tested under the same stress conditions. Based on their findings, students determine the most effective cracked steel repair method, create a report, and present their results, conclusions and recommended methods to the class as if they were presenting to the mayor and city council. This activity and its associated lesson are suitable for use during the last six weeks of the AP Statistics course; see the topics and timing note for details.
In this unit of five lessons from NCTM's Illuminations, students explore the …
In this unit of five lessons from NCTM's Illuminations, students explore the numbers of letters in their names and create bar graphs, pictographs, circle graphs, and glyphs. They also find the range, compute measures of center, and create box-and-whisker plots. Individual lessons link to related tools where appropriate, and include questions for students, assessment options, teacher reflection questions, and sometimes extensions.
No restrictions on your remixing, redistributing, or making derivative works. Give credit to the author, as required.
Your remixing, redistributing, or making derivatives works comes with some restrictions, including how it is shared.
Your redistributing comes with some restrictions. Do not remix or make derivative works.
Most restrictive license type. Prohibits most uses, sharing, and any changes.
Copyrighted materials, available under Fair Use and the TEACH Act for US-based educators, or other custom arrangements. Go to the resource provider to see their individual restrictions.