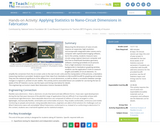
Measuring the dimensions of nano-circuits requires an expensive, high-resolution microscope with integrated …
Measuring the dimensions of nano-circuits requires an expensive, high-resolution microscope with integrated video camera and a computer with sophisticated imaging software, but in this activity, students measure nano-circuits using a typical classroom computer and (the free-to-download) GeoGebra geometry software. Inserting (provided) circuit pictures from a high-resolution microscope as backgrounds in GeoGebra's graphing window, students use the application's tools to measure lengths and widths of circuit elements. To simplify the conversion from the on-screen units to the real circuits' units and the manipulation of the pictures, a GeoGebra measuring interface is provided. Students export their data from GeoGebra to Microsoft® Excel® for graphing and analysis. They test the statistical significance of the difference in circuit dimensions, as well as obtain a correlation between average changes in original vs. printed circuits' widths. This activity and its associated lesson are suitable for use during the last six weeks of the AP Statistics course; see the topics and timing note below for details.
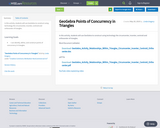
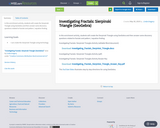
In this enrichment activity, students will create the Sierpinski Triangle using GeoGebra …
In this enrichment activity, students will create the Sierpinski Triangle using GeoGebra and then answer some discovery questions related to fractals and pattern / equation finding.
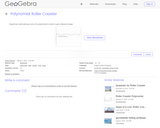
Experiment with placing roots of a polynomial in order to get a …
Experiment with placing roots of a polynomial in order to get a desired shape. The desired shape will be a unique format for a roller coaster. The activity is intended to show the relationship among polynomials, curves, and a very common application.
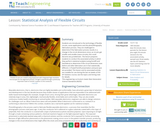
Students are introduced to the technology of flexible circuits, some applications and …
Students are introduced to the technology of flexible circuits, some applications and the photolithography fabrication process. They are challenged to determine if the fabrication process results in a change in the circuit dimensions since, as circuits get smaller and smaller (nano-circuits), this could become very problematic. The lesson prepares students to conduct the associated activity in which they perform statistical analysis (using Excel® and GeoGebra) to determine if the circuit dimension sizes before and after fabrication are in fact statistically different. A PowerPoint® presentation and post-quiz are provided. This lesson and its associated activity are suitable for use during the last six weeks of the AP Statistics course; see the topics and timing note for details.
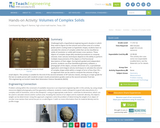
Challenged with a hypothetical engineering work situation in which they need to …
Challenged with a hypothetical engineering work situation in which they need to figure out the volume and surface area of a nuclear power plant’s cooling tower (a hyperbolic shape), students learn to calculate the volume of complex solids that can be classified as solids of revolution or solids with known cross sections. These objects of complex shape defy standard procedures to compute volumes. Even calculus techniques depend on the ability to perform multiple measurements of the objects or find functional descriptions of their edges. During both guided and independent practice, students use (free GeoGebra) geometry software, a photograph of the object, a known dimension of it, a spreadsheet application and integral calculus techniques to calculate the volume of complex shape solids within a margin of error of less than 5%—an approach that can be used to compute the volumes of big or small objects. This activity is suitable for the end of the second semester of AP Calculus classes, serving as a major grade for the last six-week period, with students’ project results presentation grades used as the second semester final test.
No restrictions on your remixing, redistributing, or making derivative works. Give credit to the author, as required.
Your remixing, redistributing, or making derivatives works comes with some restrictions, including how it is shared.
Your redistributing comes with some restrictions. Do not remix or make derivative works.
Most restrictive license type. Prohibits most uses, sharing, and any changes.
Copyrighted materials, available under Fair Use and the TEACH Act for US-based educators, or other custom arrangements. Go to the resource provider to see their individual restrictions.