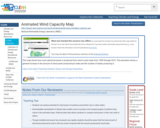
This map shows how much electrical power is produced from wind in each state from 1999 through 2010. The animation shows a general increase in the amount of wind power produced per state and the number of states producing it.
- Subject:
- Physical Science
- Material Type:
- Activity/Lab
- Provider:
- CLEAN: Climate Literacy and Energy Awareness Network
- Provider Set:
- CLEAN: Climate Literacy and Energy Awareness Network
- Author:
- National Renewable Energy Laboratory (NREL)
- Date Added:
- 02/07/2023


