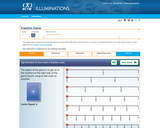
Students can use this interactive Flash applet to practice subitizing and counting …
Students can use this interactive Flash applet to practice subitizing and counting groups of objects, to understand the importance of 5 in our base-10 number system, and to learn basic addition facts. In the four included games students construct groups of 5 objects, add groups of objects within 10, and identify and record numbers within 10. Auditory prompts support students with limited reading ability.
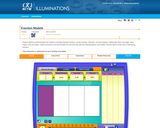
This unit of four lessons from NCTM's Illuminations lets students conduct surveys …
This unit of four lessons from NCTM's Illuminations lets students conduct surveys and represent data in a variety of ways. They also find and compare measures of center. The lessons center around a food court, where students create and use menus in a meaningful way. Topics covered include bar graphs, line plots, and pictographs, measures of center, and probability of events. Individual lessons link to related tools where appropriate, and include questions for students, assessment options, and teacher reflection questions.
In this measurement lesson plan students use their estimation and reasoning skills …
In this measurement lesson plan students use their estimation and reasoning skills to develop benchmarks for an ounce and a pound. Students test the accuracy of their estimates using a scale and give themselves a score based on how close they came to the desired weight (an ounce or a pound). This lesson plan includes a student data collection worksheet (PDF).
Using this tool, students build these classic fractals: the Koch snowflake, a …
Using this tool, students build these classic fractals: the Koch snowflake, a fractal tree, a reduced square, and the Sierpinksi triangle. As these shapes grow and change using an iterative process, students can observe patterns in the images created and in the table of values as the fractals progress through several stages.
In this lesson plan students use fraction bars to explore and compare …
In this lesson plan students use fraction bars to explore and compare the sizes of fractions. The lesson includes an activity sheet, answer key, guiding questions and prompts, assessment options and extensions, and a link to Fraction Feud, an interactive game (cataloged separately and listed as a related resource).
This applet allows students to individually practice working with relationships among fractions …
This applet allows students to individually practice working with relationships among fractions and ways of combining fractions. It is an online, one person game, with immediate feedback on incorrect moves. All instructions for this fun visual game are included and illustrated.
Explore different representations for fractions. This applet allows students to create a …
Explore different representations for fractions. This applet allows students to create a fraction,then see it as a visual model, and as percent and decimal equivalents. They can choose the model to be a circle, a rectangle, or a set model. Intended for the young learner, this version restricts the numerator to values from 0 to 20, and the denominator to benchmark values of 1, 2, 4, 5, 8, 10 and 20.
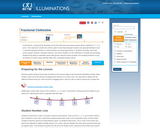
This lesson fosters a student's conceptual fraction sense with proper fractions, improper …
This lesson fosters a student's conceptual fraction sense with proper fractions, improper fractions, and mixed numbers by placing thirty fraction cards in order between given whole numbers on a number line clothesline. Users will visually identify that all proper fractions are grouped between zero and one, and that improper fractions or mixed numbers are all grouped above one. Users also play an estimation game with groups using the same principle. Instructional plan, questions for the students, assessment options, extensions, and teacher reflections are given.
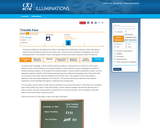
This lesson initiates the development of skills in collecting and recording data. …
This lesson initiates the development of skills in collecting and recording data. First, learners read "Freckle Juice" by Judy Blume. Then, learners collect data about a partner's face and tally the data from the whole class. They learn the convention for displaying a set of five using tally marks. Then, learners create a pictograph and pose and answer questions about the data set. This lesson guide includes questions for learners, assessment options, extensions, and reflection questions.
In this five lesson unit with overview from Illuminations, student activities explore …
In this five lesson unit with overview from Illuminations, student activities explore relationships among fractions through work with the length model. Students construct fraction strips and use fraction bars throughout the unit to make sense of basic fraction concepts, to compare fractions and order fractions and to work with equivalency in fractions. Specific learning objectives, a material list, an instructional plan, questions for the students, assessment options, extensions, and teacher reflections are given for each lesson.
This unit from Illuminations consists of five lessons designed to help students …
This unit from Illuminations consists of five lessons designed to help students understand fractions when they are represented as a part of a region. Learners investigate relationships between parts and wholes, the relative value of the fraction based on the pattern block shape and equivalency while working with physical and/or virtual pattern blocks. Instructional plan, questions for the students, assessment options, extensions, and teacher reflections are given for each lesson.
In this math activity, learners practice decision-making skills leading to a better …
In this math activity, learners practice decision-making skills leading to a better understanding of choice versus chance and building the foundation of mathematical probability. SKUNK is a variation on a dice game also known as "pig" or "hold'em." The object of SKUNK is to accumulate points by rolling dice. Points are accumulated by making several "good" rolls in a row but choosing to stop before a "bad" roll comes and wipes out all the points. SKUNK can be played by groups, by the whole class at once, or by individuals.
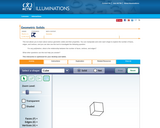
This tool allows you to learn about various geometric solids and their …
This tool allows you to learn about various geometric solids and their properties. You can manipulate each solid, seeing it from every angle. You can also color each shape to explore the number of faces, edges, and vertices. With that information, you are challenged to investigate the following question: For any polyhedron, what is the relationship between the number of faces, vertices, and edges?
Explore geometric solids and their properties with these interactive tools, beginning with …
Explore geometric solids and their properties with these interactive tools, beginning with an introduction to the faces of basic polyhedra; counting the number of faces, edges, and corners (vertices) in various solids; discovering Euler's Formula; constructing physical models of geometric solids; and identifying which geometric solids can be made from given nets.
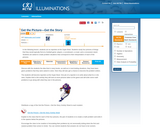
In this Illumination activity, students act as reporters at the Super Bowl. …
In this Illumination activity, students act as reporters at the Super Bowl. Students study four pictures of things that they would typically find at a football game: players, a scoreboard, a crowd, and a concession stand. Students are asked to create problem situations that correspond to their interpretation of each of the pictures. The lesson includes a student worksheet and extension questions.
This interactive lesson encourages young students to solve problems by estimating angles …
This interactive lesson encourages young students to solve problems by estimating angles and distances. They use an applet to give LOGO-like commands, e.g. forward (length), turn (right or left) to make a path that moves a turtle to a pond. Students can create a Path 1 and Path 2 and try to minimize the total path length. There is a newer applet (Turtle Pond, cataloged separately) that allows for adding or editing the commands and a choice of right angles only, or angles in multiples of 15 degrees. The lesson provides suggestions for implementation and discussion questions.
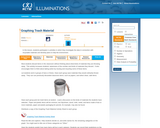
In this lesson plan students gather data about the items that they …
In this lesson plan students gather data about the items that they would normally throw in the trash. Once students collect the data they create a bar graph to display the number and kinds of materials they discard and then use this data to create a plan to reduce garbage and help the environment. The lesson plan includes an activity sheet (PDF) for graphing data and extension activity suggestions.
This lesson begins with a basic visual used in many textbooks: a …
This lesson begins with a basic visual used in many textbooks: a 10 ля 10 grid as a model for demonstrating percent as "parts per hundred" with a worksheet of these grids to print for each student. The lesson goes on to extend the model to solve various percentage problems. Especially valuable is the illustration of each problem and the thorough explanation that accompanies it.
This intereactive Flash applet helps children learn grouping, tally marks, place value, …
This intereactive Flash applet helps children learn grouping, tally marks, place value, addition, and subtraction. Students help the alien spaceship move cows into corrals by counting by 5s and 10s. They also can apply those grouping skills to practice adding and subtracting two-digit numbers with regrouping. Audio cues and prompts reinforce the user's actions and facilitate counting and the development of math language.
This lesson, from Illuminations, gives students practice in measurement and in displaying …
This lesson, from Illuminations, gives students practice in measurement and in displaying and interpreting data through box-and-whisker plots. Students may draw the plots themselves or use the online Box Plotter tool. Learning objectives, materials, student questions, extensions, teacher reflections, and NCTM Standards alignment are provided.
No restrictions on your remixing, redistributing, or making derivative works. Give credit to the author, as required.
Your remixing, redistributing, or making derivatives works comes with some restrictions, including how it is shared.
Your redistributing comes with some restrictions. Do not remix or make derivative works.
Most restrictive license type. Prohibits most uses, sharing, and any changes.
Copyrighted materials, available under Fair Use and the TEACH Act for US-based educators, or other custom arrangements. Go to the resource provider to see their individual restrictions.