Remix this template to upload your ACP lesson and unit plans into WISELearn.

Remix this template to upload your ACP lesson and unit plans into WISELearn.

In this lesson, students will learn how to enter data and formulas into an Excel spreadsheet. They'll also learn how to use the data to create and format graphs and charts.

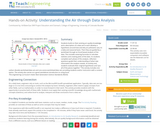
Students build on their existing air quality knowledge and a description of a data set to each develop a hypothesis around how and why air pollutants vary on a daily and seasonal basis. Then they are guided by a worksheet through an Excel-based analysis of the data. This includes entering formulas to calculate statistics and creating plots of the data. As students complete each phase of the analysis, reflection questions guide their understanding of what new information the analysis reveals. At activity end, students evaluate their original hypotheses and “put all of the pieces together.” The activity includes one carbon dioxide worksheet/data set and one ozone worksheet/data set; providing students and/or instructors with a content option. The activity also serves as a good standalone introduction to using Excel.