Students prepare for the associated activity in which they investigate acceleration by …
Students prepare for the associated activity in which they investigate acceleration by collecting acceleration vs. time data using the accelerometer of a sliding Android device. Based on the experimental set-up for the activity, students form hypotheses about the acceleration of the device. Students will investigate how the force on the device changes according to Newton's Second Law. Different types of acceleration, including average, instantaneous and constant acceleration, are introduced. Acceleration and force is described mathematically and in terms of processes and applications.
Students investigate the motion of a simple pendulum through direct observation and …
Students investigate the motion of a simple pendulum through direct observation and data collection using Android® devices. First, student groups create pendulums that hang from the classroom ceiling, using Android smartphones or tablets as the bobs, taking advantage of their built-in accelerometers. With the Android devices loaded with the (provided) AccelDataCapture app, groups explore the periodic motion of the pendulums, changing variables (amplitude, mass, length) to see what happens, by visual observation and via the app-generated graphs. Then teams conduct formal experiments to alter one variable while keeping all other parameters constant, performing numerous trials, identifying independent/dependent variables, collecting data and using the simple pendulum equation. Through these experiments, students investigate how pendulums move and the changing forces they experience, better understanding the relationship between a pendulum's motion and its amplitude, length and mass. They analyze the data, either on paper or by importing into a spreadsheet application. As an extension, students may also develop their own algorithms in a provided App Inventor framework in order to automatically note the time of each period.
Students learn how to use and graph real-world stream gage data to …
Students learn how to use and graph real-world stream gage data to create event and annual hydrographs and calculate flood frequency statistics. Using an Excel spreadsheet of real-world event, annual and peak streamflow data, they manipulate the data (converting units, sorting, ranking, plotting), solve problems using equations, and calculate return periods and probabilities. Prompted by worksheet questions, they analyze the runoff data as engineers would. Students learn how hydrographs help engineers make decisions and recommendations to community stakeholders concerning water resources and flooding.
Use this activity to explore forces acting on objects, practice graphing experimental …
Use this activity to explore forces acting on objects, practice graphing experimental data, and introduce the algebra concepts of slope and intercept of a line. A wooden 2 x 4 beam is set on top of two scales. Students learn how to conduct an experiment by applying loads at different locations along the beam, recording the exact position of the applied load and the reaction forces measured by the scales at each end of the beam. In addition, students analyze the experiment data with the use of a chart and a table, and model/graph linear equations to describe relationships between independent and dependent variables.
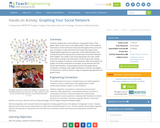
Students analyze their social networks using graph theory. They gather data on …
Students analyze their social networks using graph theory. They gather data on their own social relationships, either from Facebook interactions or the interactions they have throughout the course of a day, recording it in Microsoft Excel and using Cytoscape (a free, downloadable application) to generate social network graphs that visually illustrate the key persons (nodes) and connections between them (edges). The nodes in the Cytoscape graphs are color-coded and sized according to the importance of the node (in this activity, nodes are people in students' social networks). After the analysis, the graphs are further examined to see what can be learned from the visual representation. Students gain practice with graph theory vocabulary, including node, edge, betweeness centrality and degree on interaction, and learn about a range of engineering applications of graph theory.
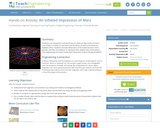
Students use scaling from real-world data to obtain an idea of the …
Students use scaling from real-world data to obtain an idea of the immense size of Mars in relation to the Earth and the Moon, as well as the distances between them. Students calculate dimensions of the scaled versions of the planets, and then use balloons to represent their relative sizes and locations.
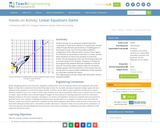
Students groups act as aerospace engineering teams competing to create linear equations …
Students groups act as aerospace engineering teams competing to create linear equations to guide space shuttles safely through obstacles generated by a modeling game in level-based rounds. Each round provides a different configuration of the obstacle, which consists of two "gates." The obstacles are presented as asteroids or comets, and the linear equations as inputs into autopilot on board the shuttle. The winning group is the one that first generates the successful equations for all levels. The game is created via the programming software MATLAB, available as a free 30-day trial. The activity helps students make the connection between graphs and the real world. In this activity, they can see the path of a space shuttle modeled by a linear equation, as if they were looking from above.
8th Grade Science teacher Peter Hill from King Middle School in Maine …
8th Grade Science teacher Peter Hill from King Middle School in Maine shares a quick strategy tool and strategy he refers to as "word cloud". The "word cloud" is generated by a computer program that takes words from an article and generates a "cloud" with different sizes of words with the size emphasizing the frequency of the word. Mr. Hill uses this as a quick pre-reading activity to increase curiosity and engagement and to have students anticipate what the article or essay is about and what the main idea is. Teachers might also consider a twist to this idea and have student groups create their own word cloud after reading a selected text.11
Students experience data collection, analysis and inquiry in this LEGO® MINDSTORMS® NXT …
Students experience data collection, analysis and inquiry in this LEGO® MINDSTORMS® NXT -based activity. They measure the position of an oscillating platform using a ultrasonic sensor and perform statistical analysis to determine the mean, mode, median, percent difference and percent error for the collected data.
"Opening the World through Journaling: Integrating Art, Science, and Language Arts" teaches …
"Opening the World through Journaling: Integrating Art, Science, and Language Arts" teaches children to become keen observers of the natural world by drawing and writing about the plants and animals in situ. In a set of nested exercises, students use games to gain confidence in drawing and writing as a way to gather information. Later, they employ these skills to put together a field guide, make treasure maps, and to write short stories and poems.
Building on their understanding of graphs, students are introduced to random processes …
Building on their understanding of graphs, students are introduced to random processes on networks. They walk through an illustrative example to see how a random process can be used to represent the spread of an infectious disease, such as the flu, on a social network of students. This demonstrates how scientists and engineers use mathematics to model and simulate random processes on complex networks. Topics covered include random processes and modeling disease spread, specifically the SIR (susceptible, infectious, resistant) model.
Prepared with pre-algebra or algebra 1 classes in mind, this module leads …
Prepared with pre-algebra or algebra 1 classes in mind, this module leads students through the process of graphing data and finding a line of best fit while exploring the characteristics of linear equations in algebraic and graphic formats. Then, these topics are connected to real-world experiences in which people use linear functions. During the module, students use these scientific concepts to solve the following hypothetical challenge: You are a new researcher in a lab, and your boss has just given you your first task to analyze a set of data. It being your first assignment, you ask an undergraduate student working in your lab to help you figure it out. She responds that you must determine what the data represents and then find an equation that models the data. You believe that you will be able to determine what the data represents on your own, but you ask for further help modeling the data. In response, she says she is not completely sure how to do it, but gives a list of equations that may fit the data. This module is built around the legacy cycle, a format that incorporates educational research feindings on how people best learn.
No restrictions on your remixing, redistributing, or making derivative works. Give credit to the author, as required.
Your remixing, redistributing, or making derivatives works comes with some restrictions, including how it is shared.
Your redistributing comes with some restrictions. Do not remix or make derivative works.
Most restrictive license type. Prohibits most uses, sharing, and any changes.
Copyrighted materials, available under Fair Use and the TEACH Act for US-based educators, or other custom arrangements. Go to the resource provider to see their individual restrictions.