This is an activity about searching online data archives for solar wind …
This is an activity about searching online data archives for solar wind events. Learners will find at least three episodes of increased solar wind activity impacting Earth using direct measurements of solar wind velocity and density. Then, they will characterize each events by its rise time, the time it takes for the solar wind speed to rise from normal levels to the peak speed of the event, and the percentage increase in solar wind velocity. This is Activity 11 of the Space Weather Forecast curriculum.
This is an activity about comparing images of the Sun in different …
This is an activity about comparing images of the Sun in different wavelengths of light. Learners will examine solar images taken by the SOHO spacecraft to look for differences in the features that are visible in the various wavelengths of light. This activity requires access to the internet to view or print images of the Sun. This is Activity 7 of the Sun As a Star afterschool curriculum.
This is an activity about using what you can see to identify …
This is an activity about using what you can see to identify what you cannot see. Learners will use the criteria they developed in the previous activity in this sequence and analyze whole Sun magnetic map data sets in order to find suspected sunspots on the far side of the Sun. This is Activity 7 of the Space Weather Forecast curriculum.
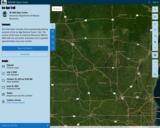
This data layer includes lines representing existing sections of the Ice Age …
This data layer includes lines representing existing sections of the Ice Age National Scenic Trail. This version of the data is hosted by Wisconsin DNR for DNR staff use and public download and is updated approximately every two months.
This layer is hosted by Wisconsin DNR, and reflects Ice Age Trail updates received from the Ice Age Trail Alliance on December 21st, 2023. This layer is typically updated approximately every two months and is primarily for the purpose of DNR staff use and public download from DNR's Open Data Portal. For more current trail data contact Tiffany Stram (tiffany@iceagetrail.org) GIS/Technology Specialist at Ice Age Trail Alliance. For the official depiction of Ice Age Trails in Wisconsin, see Ice Age Trail Alliance's Ice Age National Scenic Trail Existing Sections - Official Layer: https://www.arcgis.com/home/item.html?id=735b25ad50e74520b7396d9168f53cfc.
This data layer includes lines representing existing sections of the Ice Age National Scenic Trail. This layer is a combination of GPS and digitized data, merged to represent one complete data layer for the IAT. The data was developed by the Ice Age Trail Alliance (IATA) in cooperation with the National Park Service's Ice Age Trail Office.
This ITS ePrimer provides transportation professionals with fundamental concepts and practices related …
This ITS ePrimer provides transportation professionals with fundamental concepts and practices related to ITS technologies. This resource can help practicing professionals and students better understand how ITS is integrated into the planning, design, deployment, and operations of surface transportation systems. The ePrimer is both a stand-alone reference document for the practitioner as well as a text for education and training programs.
This is an activity about magnetism. Learners will experiment using horseshoe and …
This is an activity about magnetism. Learners will experiment using horseshoe and bar magnets along with various materials in order to identify the effects of magnets on each other and on other materials. This is the third activity as part of the iMAGiNETICspace: Where Imagination, Magnetism, and Space Collide educator's guide. Instructions for downloading the iBook educator's guide and the associated Transmedia book student guide are available at the resource link.
This link has a teacher guide, 3 student graphing activity sheets, rubric …
This link has a teacher guide, 3 student graphing activity sheets, rubric and a complete description of the activities related to climate change and invasive species.
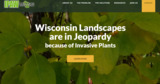
The Invasive Plants Association of Wisconsin (IPAW) is a nonprofit membership-based organization …
The Invasive Plants Association of Wisconsin (IPAW) is a nonprofit membership-based organization whose mission is to promote better stewardship of the natural resources of Wisconsin by advancing the understanding of invasive plants, preventing their introduction, and encouraging the control of their spread.
IPAW defines an invasive plant as one that invades native plant communities and impacts those native communities by displacing or replacing native vegetation.
Both a weed and an invasive plant are plants out of place, but an invasive plant encroaches into forests, roadsides, and prairies where it is unchecked by the devotions of an obsessive backyard gardener. The ramifications of invasive plants are so much more ominous than that of weeds because they can and do destroy the natural diversity of native vegetation.
Ironically, many invasive plants get their foothold through well-meaning gardeners who introduce the species as a lovely accent to their patch of paradise. However, many of these plants come from foreign lands and do not have the natural controls that a native plant has. Soon the nonnative plant takes over – first the garden and then, by propagating via the wind, through deep-set runners and by the cooperation of willing birds carrying the seeds, more distant places.
There are many plants that are invasive in Wisconsin. To ease you into an awareness of invasive plants without overwhelming you, IPAW has developed this list of Wisconsin’s Worst foreign invaders.
Series of 43 page-size maps showing the chronology of the last glaciation's …
Series of 43 page-size maps showing the chronology of the last glaciation's advances and retreats across Wisconsin. Includes a brief discussion about how the maps were made, how lake positions were determined, as well as a list of selected references.
Students will be able to determine the roles of women on the …
Students will be able to determine the roles of women on the home front and battlefront during and after the Civil War., Examine historical events that are significant to Mississippi culture, but also relate to women from other states, evaluate the contributions of women, African Americans, and other minority groups to the war effort. Students will be able to examine primary sources to gain an understanding of women's experiences and contributions to the Civil War.
The Defense POW/MIA Accounting Agency is designated to provide the fullest possible …
The Defense POW/MIA Accounting Agency is designated to provide the fullest possible accounting for our missing personnel to their families and the nation. Resource links through this website include: MIA/POW by war/conflict (including searchable databases) , profiles of unaccounted and accounted individuals, current identifications and searches, and video links to lab tours demonstrating how they do their work.
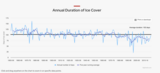
Observational data set since 1855 from both Madison area lakes Mendota and …
Observational data set since 1855 from both Madison area lakes Mendota and Monona from the Wisconsin State Climatology Office and Nelson Institute for Environmental Studies
This is an activity about the period of the Sun's rotation. Learners …
This is an activity about the period of the Sun's rotation. Learners will use image of the Sun from the SOHO spacecraft and a transparent latitude/ longitude grid called a Stonyhurst Disk to track the motion of sunspots in terms of degrees of longitude. Using this angular motion measurement, learners will then calculate the sunspot’s angular velocity in order to determine the rotation period of the Sun. This activity requires access to the internet to obtain images from the SOHO image archive. This is Activity 4 of the Space Weather Forecast curriculum.
Wisconsin's Meteorites dataset collection of all of the known locations of meteorites, …
Wisconsin's Meteorites dataset collection of all of the known locations of meteorites, plus known craters formed from larger meteorites, including the Rock Elm Disturbance found in West Central Wisconsin.
In this activity, students pose several hypotheses for what will happen if …
In this activity, students pose several hypotheses for what will happen if you continue heating or supplying energy to the hot and cold planet models (Mercury, Mars, Venus, and Earth) and then test their hypotheses using a spreadsheet based radiation balance model. The activity supports investigation of a real world challenge, experimenting with life support conditions for Mars at an Arctic outpost. The interactive model runs are conducted using a Java applet. This resource includes student worksheets, assessment questions and a teacher's guide. This is Activity B in module 2, Modeling hot and cold planets, of the resource, Earth Climate Course: What Determines a Planet's Climate? The course aims to help students to develop an understanding of our environment as a system of human and natural processes that result in changes that occur over various space and time scales.
This is an activity about solar rotation and sunspot motion. Learners will …
This is an activity about solar rotation and sunspot motion. Learners will use a sphere or ball to model the Sun and compare the observed lateral motion of sunspots to their line-of-sight motion. This is Activity 1 of the Space Weather Forecast curriculum.
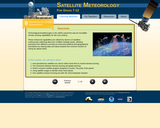
In this online, interactive module, students learn how enhanced Earth remote-sensing capabilities …
In this online, interactive module, students learn how enhanced Earth remote-sensing capabilities are used by dozens of satellites that are continuously collecting data from multiple vantage points. This allows scientists from different countries to transcend political and geographical boundaries by sharing data and ideas towards the common mission of caring for planet Earth. The module is part of an online course for grades 7-12 in satellite meteorology, which includes 10 interactive modules. The site also includes lesson plans developed by teachers and links to related resources. Each module is designed to serve as a stand-alone lesson, however, a sequential approach is recommended. Designed to challenge students through the end of 12th grade, middle school teachers and students may choose to skim or skip a few sections.
This assignment uses a computer simulation of fruit fly genetics to have …
This assignment uses a computer simulation of fruit fly genetics to have students design and interpret monohybrid crosses of a trait with simple dominant and recessive alleles. Detailed instructions with animated examples, background material, a sample report and a rubric are included.
This site is a collaborative effort between the herbaria of the UW-Madison …
This site is a collaborative effort between the herbaria of the UW-Madison (WIS) and the UW-Steven's Point (UWSP), along with most of the other herbaria located in the state of Wisconsin. It contains information on each of the more than 2600 vascular plant species that occurs in Wisconsin, including photos, distribution maps, specimen records, and more.
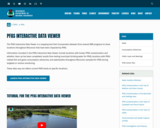
The PFAS Interactive Data Viewer is a mapping tool that incorporates datasets …
The PFAS Interactive Data Viewer is a mapping tool that incorporates datasets from several DNR programs to show locations throughout Wisconsin that have been impacted by PFAS.
Information included in the PFAS Interactive Data Viewer include locations with known PFAS contamination and whether clean up has been completed; results from testing municipal drinking water for PFAS; locations with PFAS-related fish and game consumption advisories; and waterbodies throughout Wisconsin sampled for PFAS during targeted or routine monitoring.
These data may not reflect current PFAS levels at specific locations.
No restrictions on your remixing, redistributing, or making derivative works. Give credit to the author, as required.
Your remixing, redistributing, or making derivatives works comes with some restrictions, including how it is shared.
Your redistributing comes with some restrictions. Do not remix or make derivative works.
Most restrictive license type. Prohibits most uses, sharing, and any changes.
Copyrighted materials, available under Fair Use and the TEACH Act for US-based educators, or other custom arrangements. Go to the resource provider to see their individual restrictions.