Introduces the concepts, techniques, and devices used to measure engineering properties of …
Introduces the concepts, techniques, and devices used to measure engineering properties of materials. Emphasis on measurement of load-deformation characteristics and failure modes of both natural and fabricated materials. Weekly experiments include data collection, data analysis, and interpretation and presentation of results.
In this data collection and analysis activity students investigate data in connection …
In this data collection and analysis activity students investigate data in connection with recyclable materials and develop plans to help the environment. This activity requires students to keep track of their own paper use for a week, graph the data with a line graph and then interpret their results with a partner. The lesson includes student worksheets and extension suggestions.
This activity is a classroom and schoolyard investigation where students collect daily …
This activity is a classroom and schoolyard investigation where students collect daily temperature and precipitation readings, weather observations, and weekly phenology reports in a phenology binder and in nature journals. Students then analyze this data and compare to recorded values in the Weatherguide calendar.
Students groups create scientific research posters to professionally present the results of …
Students groups create scientific research posters to professionally present the results of their AQ-IQ research projects, which serves as a conclusion to the unit. (This activity is also suitable to be conducted independently from its unit—for students to make posters for any type of project they have completed.) First, students critically examine example posters to gain an understanding of what they contain and how they can be made most effective for viewers. Then they are prompted to analyze and interpret their data, including what statistics and plots to use in their posters. Finally, groups are given a guide that aids them in making their posters by suggesting all the key components one would find in any research paper or presentation. This activity is suitable for presenting final project posters to classmates or to a wider audience in a symposium or expo environment. In addition to the poster-making guide, three worksheets, six example posters, a rubric and a post-unit survey are provided.
In this lesson plan students learn to create bar graphs using unifix …
In this lesson plan students learn to create bar graphs using unifix cubes, translate this representation to graph paper, and then compare the data that has been collected and displayed. Students are encouraged to make up their own questions about the data (favorite juice) and to practice with multiple sets of data. Sample questions for students and extension ideas are included. The lesson contains links to a PDF of graph paper and the Bar Grapher tool which is cataloged separately in this database.
Covers computational and data analysis techniques for environmental engineering applications. First third …
Covers computational and data analysis techniques for environmental engineering applications. First third of subject introduces MATLAB and numerical modeling. Second third emphasizes probabilistic concepts used in data analysis. Final third provides experience with statistical methods for analyzing field and laboratory data. Numerical techniques such as Monte Carlo simulation are used to illustrate the effects of variability and sampling. Concepts are illustrated with environmental examples and data sets. This subject is a computer-oriented introduction to probability and data analysis. It is designed to give students the knowledge and practical experience they need to interpret lab and field data. Basic probability concepts are introduced at the outset because they provide a systematic way to describe uncertainty. They form the basis for the analysis of quantitative data in science and engineering. The MATLABĺ¨ programming language is used to perform virtual experiments and to analyze real-world data sets, many downloaded from the web. Programming applications include display and assessment of data sets, investigation of hypotheses, and identification of possible casual relationships between variables. This is the first semester that two courses, Computing and Data Analysis for Environmental Applications (1.017) and Uncertainty in Engineering (1.010), are being jointly offered and taught as a single course.
This unit contains two lessons which help students develop number sense through …
This unit contains two lessons which help students develop number sense through activities involving collection, representation, and analysis of data. Students also practice reading and writing large numbers and develop estimation skills. In Lesson 1, Every Breath You Take, students estimate the number of breaths taken during a specified time, experiment, and display real-life data. In Lesson 2, Making Your First Millions, students develop the concept of a million by working with smaller numerical units, such as blocks of 10 or 100, and then expanding the idea by multiplication or repeated addition. They analyze situations and identify patterns that will enable them to develop the concept of large numbers. Each lesson includes student activity sheets, an instructional plan, and extensions.
This project-based unit on statistics provides an opportunity for problem solving through …
This project-based unit on statistics provides an opportunity for problem solving through real-world data collection and analysis. Students follow the seven- step "Elementary Mathematics Research Model" by identifying a research question, predicting the answer, and conducting research to test their hypothesis. Students use the mean, mode and median to analyze their data and use graphs to represent their findings so they can draw and justify conclusions. The lesson plan includes examples, questions for students, and possible assessment and extension ideas.
In this 7- lesson unit students use tallies, pictographs, bar graphs, line …
In this 7- lesson unit students use tallies, pictographs, bar graphs, line plots, circle graphs, box-and-whisker plots, and glyphs to collect and display data about healthy eating. The unit includes lessons in which two sets of data are being compared and data sets are being analyzed for measures of central tendency (mean, median, mode). Learning objectives, materials, student questions, extensions, teacher reflections, and links to create graphs virtually are included.
In this math activity, learners are presented with a problem: two bowls …
In this math activity, learners are presented with a problem: two bowls are suspended from the ceiling by springs. One bowl is lower than the other. In one bowl, you can only place marbles; in the other bowl, you can only place bingo chips. Learners investigate how many items must be placed in each bowl so that the heights of the bowls are the same, and in doing so, solve a system of linear equations. This lesson guide includes questions for learners, assessment options, extensions, and reflection questions.
This Illuminations activity focuses on making predictions and the collection and analysis …
This Illuminations activity focuses on making predictions and the collection and analysis of data by having students take their pulse after different exercises. All individual data is collected in a classroom chart where the results are interpreted and conclusions drawn. The lesson includes a student worksheet and extension questions.
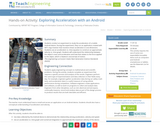
Students conduct an experiment to study the acceleration of a mobile Android …
Students conduct an experiment to study the acceleration of a mobile Android device. During the experiment, they run an application created with MIT's App Inventor that monitors linear acceleration in one-dimension. Students use an acceleration vs. time equation to construct an approximate velocity vs. time graph. Students will understand the relationship between the object's mass and acceleration and how that relates to the force applied to the object, which is Newton's second law of motion.
In this two-day lesson plan students collect, display, and analyze data about …
In this two-day lesson plan students collect, display, and analyze data about the eye color of their classmates. On day one, students display the eye color data in a pictograph and discuss what questions can and cannot be answered using this graph. On the second day of the lesson, data from a partner class is used to create a second pictograph. Students then compare these graphs and determine what questions can and cannot be answered using these two graphs. Questions and extension suggestions (including making a circle graph to represent data) are also included in the lesson plan.
This unit of four lessons from NCTM's Illuminations lets students conduct surveys …
This unit of four lessons from NCTM's Illuminations lets students conduct surveys and represent data in a variety of ways. They also find and compare measures of center. The lessons center around a food court, where students create and use menus in a meaningful way. Topics covered include bar graphs, line plots, and pictographs, measures of center, and probability of events. Individual lessons link to related tools where appropriate, and include questions for students, assessment options, and teacher reflection questions.
This lesson initiates the development of skills in collecting and recording data. …
This lesson initiates the development of skills in collecting and recording data. First, learners read "Freckle Juice" by Judy Blume. Then, learners collect data about a partner's face and tally the data from the whole class. They learn the convention for displaying a set of five using tally marks. Then, learners create a pictograph and pose and answer questions about the data set. This lesson guide includes questions for learners, assessment options, extensions, and reflection questions.
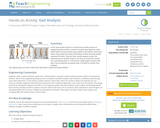
In this open-ended, hands-on activity that provides practice in engineering data analysis, …
In this open-ended, hands-on activity that provides practice in engineering data analysis, students are given gait signature metric (GSM) data for known people types (adults and children). Working in teams, they analyze the data and develop models that they believe represent the data. They test their models against similar, but unknown (to the students) data to see how accurate their models are in predicting adult vs. child human subjects given known GSM data. They manipulate and graph data in Excel® to conduct their analyses.
In this math activity, learners practice decision-making skills leading to a better …
In this math activity, learners practice decision-making skills leading to a better understanding of choice versus chance and building the foundation of mathematical probability. SKUNK is a variation on a dice game also known as "pig" or "hold'em." The object of SKUNK is to accumulate points by rolling dice. Points are accumulated by making several "good" rolls in a row but choosing to stop before a "bad" roll comes and wipes out all the points. SKUNK can be played by groups, by the whole class at once, or by individuals.
In this lesson plan students gather data about the items that they …
In this lesson plan students gather data about the items that they would normally throw in the trash. Once students collect the data they create a bar graph to display the number and kinds of materials they discard and then use this data to create a plan to reduce garbage and help the environment. The lesson plan includes an activity sheet (PDF) for graphing data and extension activity suggestions.
No restrictions on your remixing, redistributing, or making derivative works. Give credit to the author, as required.
Your remixing, redistributing, or making derivatives works comes with some restrictions, including how it is shared.
Your redistributing comes with some restrictions. Do not remix or make derivative works.
Most restrictive license type. Prohibits most uses, sharing, and any changes.
Copyrighted materials, available under Fair Use and the TEACH Act for US-based educators, or other custom arrangements. Go to the resource provider to see their individual restrictions.